There was one line in the Donald’s paean to his own greatness last night that says it all. Namely, his claim that he has actually reversed the failed policies he inherited and has fostered a dramatic pivot to a brighter future:
If we had not reversed the failed economic policies of the previous administration, the world would not now be witness to America’s great economic success.
Let’s see.
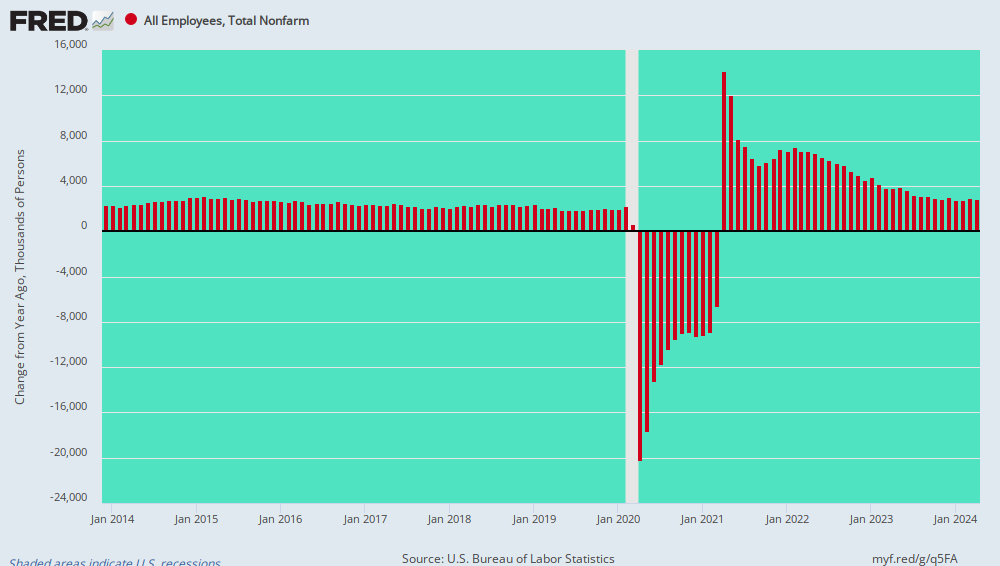
During the Donald’s first 36 months in office, the average monthly job gain has been 193,000. But since the average monthly gain was 224,000 during Obama’s final 36 months, we are not sure that the Donald’s ballyhooed “reversal” was even in the right direction.
In fact, the rate of monthly job gains is absolutely slowing down, as befits the late stages of the longest business cycle expansion in history. During the 12 months ended in December 2019, therefore, the year-year-over-year job gain of 2.108 million was lower than any month during the last 36 months of Barry’s sojourn in the Oval Office.
Year-Over-Year NFP Job Growth During Obama’s Last 36 Months and Trump’s First 36 Months

More or less, you need a magnifying glass to see where Barry’s term ends and the Donald’s begins in the chart above. And that’s apropos the fact that neither had much to do with a laboring business cycle expansion that reflected capitalist America doing its level best to keep on trucking against the headwinds of bad policy emanating from Washington—policies that did not materially change after January 20, 2017 (see below).
We have long insisted, of course, that GDP is a flawed measure of both the economic growth rate and the level of sustainable prosperity. That’s because it can be tricked into temporary ebullience by piling on debt and thereby borrowing growth from the long-term future.
But if you just must measure the aggregate economy, the best metric is real final sales.
Its virtue is that it’s essentially GDP shorn of the severe inventory fluctuations which occur from quarter to quarter. And these fluctuations are made all the more extreme owing to the fact that GDP accounting is based on the second derivative: That is, the change in the quarterly change in inventories–a fleeting statistical willo-wisp, all traces of which wash out of the GDP level over any reasonable period of time, anyway.
Once again, however, the Donald’s great “reversal” implies that lower is the new higher. That is, during the first 12 quarters of his tenure, real final sales have grown at 2.61% per annum, a figure measurably lower than the 2.91% per annum gain recorded during Obama’s last 12 quarters.
The true economic aspect of the chart, however, has nothing to do with the arm-waving of either Obama or Trump during their respective tenures. In the course of a debt-fueled business cycle expansion, the growth rate actually should be slowing as the expansion cycle gets long-in-the-tooth and ever more heavily freighted down with debt.
That is clearly happening, but it’s nothing to be boasting about in the SOTU; it’s actually a warning that what lies ahead ain’t going to look nothing like MAGA.
Real Final Sales Growth: Trump’s First 12 Quarters Versus Obama’s Last 12 Quarters

Indeed, welcome as it was, the Donald’s full-throated declamations against socialism in health care last night actually expose another considerable chink in his MAGA narrative.