In the world of economics there are factoids and facts, headlines and baselines and cherry-picking and trend-exegesis. The first term of these couplets is what they do day in and day out on both ends of the Acela Corridor, thereby obfuscating the house of financial and fiscal cards on which the present fantasy rests.
And that goes for both the main stream and MAGA versions thereof.
By contrast, we do endeavor to pursue the second term of these couplets, thereby elucidating the rotten foundation which looms below. And in that context, there are few facts/baselines/trends more important that the metrics presented in Part 1 about the pitiful growth rate of the US business economy.
To wit, on a one-year, six-year and 11-year basis, the annualized growth rate of total business sales–manufactures, wholesale and retail–is just 2.0%. And that singular number is of over-riding importance because business sales are the source of all value added, prosperity and wealth and because they are expressed in nominal dollars, which is what Uncle Sam taxes and borrows.
That is to say, try paying your taxes in inflation-adjusted real GDP and you will soon find out that Uncle Sam’s hospitality suites are not as plush as they’ve been cracked-up to be.
More importantly, when it comes to directionality, the above 11-year long 2.0% nominal growth factor demolishes both the Trumpite and the Wall Street narratives in favor of the truth of the matter. That is, there has been no Trump Boom and no late-cycle economic acceleration, as the White House and the bubblevision talking heads fatuously hold, respectively.
It’s still a 2.0% economy in nominal terms and a flat-lining one after you wring out the inflation. As it happens, that was true on a December-to-December basis in 2018—even after an insane $300 billion fiscal stimulus/Treasury borrowing spree during year #10 of a tired business recovery.
On the other hand, the present 2% economy reflects a radical downshift and deterioration from the 5.0% trend in nominal business sales that prevailed during 1992-2007.
Stated differently, the US business economy was, is and will be growing at just two-fifths (2% per annum) of its pre-crisis rate (5% per annum). And as we demonstrate below, that low nominal growth trend amounts to the fiscal death knell for Welfare State/Warfare State encumbered America.
Nor is there any reason to believe that Washington is capable of finding an elixir anytime soon that will restore the old 5% growth business economy. That’s because the low-growth body blow has already been administered to main street America.
We are referring to the massive accretion of public and private debt since the mid-1980s and the accompanying financialization of the American economy driven by the Wall Street casino. That historical anomaly and financial metastasis has hollowed out the growth capacity of the business economy over the last 30 years by channeling capital flows from productive investment to financial speculation and rent-seeking.
At the same time, the monumental debt service burden accumulated by all sectors of the economy during that borrowing spree will weigh even further on economic growth capacity in the years ahead. And on top of that, the anti-growth Baby Boom retirement burden will settle heavily on America’s diminished economic prospects, as well.
As we have indicated, the two extra turns of public and private debt on the US economy amount to a $40 trillion anti-growth albatross. Yet that is exactly what has materialized as the US economy’s historic 1.5X debt-to-income ratio has metastized to 3.5X during the last 50 years.
More importantly, the so-called financial crisis was surely a dire warning about the soaring debt burden, but exactly nothing has been done about that condition since the pre-crisis peak in 2007.
In fact, the total debt burden has soared from $53 trillion to $70 trillion, and the leverage ratio to income has remained stranded in the nosebleed section of both history and financial rationality at 3.5X.
As the saying goes, a perfectly good crisis has now been wasted, and the metastasizing debt can was merely kicked down the road.

In some real sense, the consequence of the above eruption of the national leverage ratio is essentially an economic doom-loop. That is, the financial system at the center of the American economy has become so corrupted by leveraged finance and rampant speculation that it can’t self-correct; and even if it tried, the Keynesian central bankers who run the system would barge in with massive liquidity injections and anti-seller word clouds to cut it short.
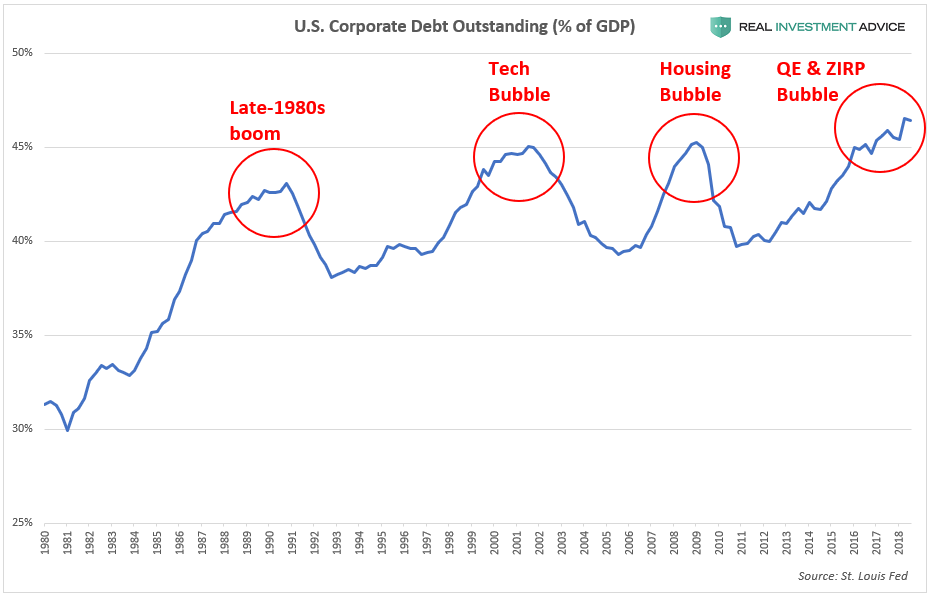
That’s the only way you can explain the chart below. The corporate elite was petrified with fear in the fall and winter of 2008-2009 and for a brief span cutback hard on the financial engineering games that had already taken total business debt to $10.5 trillion on the eve of the Lehman collapse, and corporate debt alone to a record 45% of GDP.
But as is evident from the chart, after bottoming in 2010-2011, the business borrowing spree was again off to the races under the endless encouragement of the Fed’s interest rate repression, and the secondary impact that had on sending fund managers into an endless quest for yield in increasingly more risky corners of the debt markets.
So corporate debt alone doubled since 2007, and a record 50% of the $9 billion outstanding is rated BBB or less (i.e. junk). That took the chart below into uncharted waters, and when non-corporate debt is factored-in, the risk is even more acute.
In fact, there is now nearly $15 trillion of total business debt outstanding compared to the aforementioned $10.5 trillion on the eve of the financial crisis, and to just $6.2 trillion in the year 2000.
In ratio terms, today’s staggering level of total business debt amounts to 75% of GDP. By contrast, back in 2000 the ratio was just 60% and in 1970 it was only 30%, which represented an age-old stable mean.

The problem with massively excessive debt, of course, is not only its go-forward service costs, but also the matter of what it was spent on during the accumulation phase. And that’s where the real skunk in the wood pile manifests itself.
Overwhelmingly, the incremental borrowings of the business sector in recent decades have gone into financial engineering on Wall Street (i.e. stock buybacks, M&A deals etc), rather than the acquisition of productive assets and growth capacity on main street. And the litmus test for that is a metric called real net investment in fixed business assets.
The issue here is that Wall Street loves to focus on gross business CapEx, including plant, equipment, software and technology. Indeed, the bubblevision boys and girls are always pointing to putative green shoots, often expressed in annualized real growth rates of 5-10%.
For instance, during the past 12 months, their favorite growth indicator, real gross private investment in nonresidential fixed assets (i.e.business CapEx), has increased by 7.1%; and is now 65% above where it stood nine years ago in September 2009.
Except you can’t count highly cyclical components of the economy from the bottom of the cycle, and more importantly, you ought to consider what the “gross” term in this metric actually means.
Namely, that it represents current year CapEx spending to replace what is consumed in current year production (depreciation and amortization of capital assets) plus any additional allowance for the growth of existing capacity.
Needless to say, if gross business investment is only equal to capital consumption, then the annual gain in the first number can be as big as you please. When gross investment spending is totally absorbed by replacement of worn out capital, net investment is punk and the underlying economy is going nowhere.
As it happened, during the heyday of US economic growth and prosperity, gross CapEx vastly out-ran both inflation and the current year consumpti0n or wear and tear on the existing stock of productive capital.
Between 1967 and 1985, for example, real net fixed investment more than doubled–notwithstanding cyclical vicissitudes. The annualized growth rate over that 18-year period was 5.0%, and it was on that foundation of robustly rising capital stock that the American economy prospered.

By contrast, the exact opposite has happened since the pre-crisis peak in Q4 2007. At that time, annual gross business investment was a little over $2.0 trillion per annum and current capital consumption slightly under $1.6 trillion.
During the next ten years, real gross investment grew by $555 billion, but the annual rate of capital consumption was right behind, rising by $547 billion.
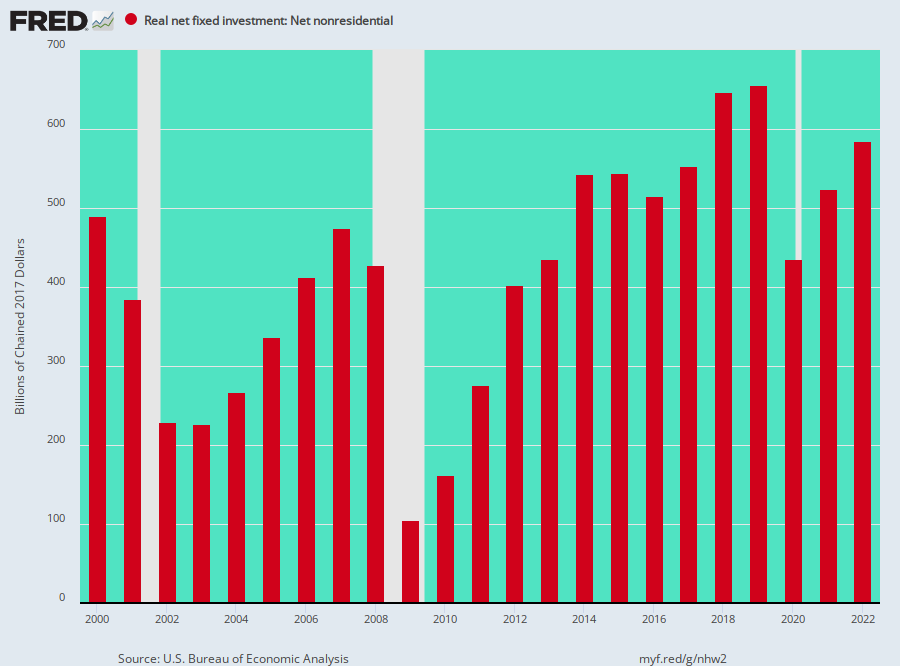
We’d not only call that close enough to the same for government work, but also call it powerful proof that the main street economy has been truly impaled on the flatline. As shown in the graph below, the thing that counts for growth and prosperity is net investment spending growth, and not only since 2007, but actually since the year 2000 there has been none of it!
That’s right. No matter how many times the talking heads of bubblevision told you there was another good quarter for capital spending, it flat out wasn’t true. What they were dispensing was talking points for their Wall Street sales and trading desks.
As we show in the chart below, real net investment of $497 billion in the year 2000 has meandered around the cyclical barn during the interim, but as of 2017 it actually stood below the turn of the century benchmark at $494 billion.
So the flatlining business eco0nomy of the last decade should really be no mystery, either. How could it be growing robustly when the nation’s capital stock growth rate has been dead in the water for nearly two decades?
Needless to say, the above net CapEx chart begs the question as to where all the business borrowing went. After all, business debt soared by nearly $9 trillion since the year 2000, rising from $6.2 trillion to more than $15 trillion.
The answer, of course, is that most of this business debt got recycled in circular, Ponzi fashion back into Wall Street. There, the endless disgorgement of business cash flow and balance sheet capacity in M&A deals and stock buybacks drove up the price of equities, which, in turn, levitated the capitalization rates for all risk assets including corporate BBBs and junk bonds.
And, yes, ridiculously high rates of return on the lower grades of corporate debt simply stoked asset manager demand, thereby fostering new rounds of attractive funding for even more corporate financial engineering.
At the end of the day, this destructive cycle manifested itself in the next chart below. Back in 1971, the ratio of household net worth to wage and salary income was about 7:1, reflecting about $4 trillion of household net worth against $570 billion of annual wage and salary income.
By the dawn of the Greenspan era in 1987, household net worth (financial and housing assets valued at market minus liabilities) had rising to $18.2 trillion against wage and salary income of $2.3 trillion, thereby nudging the ratio to 8:1.
But once Greenspan and his successors and assigns got the Fed’s printing presses running at white heat, it was off to the races. During the next 30 years of relentless financial and housing asset inflation, household net worth soared to $108 trillion or by 500%—even as wage and salary income rose by just 290% to $8.8 trillion.
Accordingly, household net worth—marked to the Fed’s inflated asset prices—now stands at 12X wage and salary income.
But here’s the thing. There is actually no reason why the capitalization rate of wage and salary income should have rising from its historic 7:1 ratio in the first place.
In fact, at the latter ratio, household net worth today would stand at just $62 trillion, implying that the household sector is floating on some $45 trillion of bottled air.

It would be one thing, of course, if financial and net housing assets (after mortgages and other debt) were distributed in the same way that resulted from the prosperous main street capitalism which prevailed prior to the rise of Greenspanian Bubble Finance.
But as demonstrated in the chart below that is not remotely the case. To wit, on the eve of the Greenspan money-pumping era, the top 1% held about 34% of household net worth and the bottom 90% had about 32%—levels that had been steady for most of the post-war period.
But since then there has been a distributional trainwreck. By 2016 the bottom 90% share had plummeted to 21%—largely due to the crash of heavily leveraged (mortgaged) housing assets held by the middle class. At the same time, the top 1% share had soared to 40%— a level never before seen in American history, including in the far less complete and reliable data for 1929.
And that get’s us to the thundering fiscal crisis that lies dead ahead. America essentially traded its growth capacity for a fantasy-land of bubble wealth that has largely accrued to the top 1% and 10% of households, which own 45% and 85% of the nation’s net worth, respectively.
But when the great central bank fueled bubble finally bursts, political power and policy will lurch to the Left, even as the nation’s fiscal accounts crater like never before.
In that context, the utterly preposterous budget presented by the Trump White House on Monday will be seen as marking the final flight of fantasy that has been building for more than four decades.
In Part 3, the risible farce embodied in the Trump budget for FY 2020 will be dismembered limb-for-limb.
