Another batch of recent “incoming data” amounted to still more evidence that the false sugar high of last summer has already petered out. This morning’s February industrial production index for manufacturing, for instance, continued to roll-over and is already back to its July 2018 interim high.
Moreover importantly, it now stands only 2.4% higher than it was four years ago in November 2014 during the last global commodity/trade/production uptick. Worse still, it remains 2.5% below its pre-crisis peak level of December 2007.
So we can’t repeat enough. When the entire manufacturing sector of this US economy is still measurably smaller than it was 11 years ago, what is going on ain’t no boom!
Indeed, the index’s internals have been even shakier. February production of consumer goods was actually down by nearly 2% from its last April level and is still 6% below its October 2007 pre-crisis peak.
As shown in the chart, the only solid gain in the entire industrial production complex is for oil and gas extraction, driven by the shale boom. Of course, we know why that happened: The Fed’s massive financial repression has sent fund managers scrambling for yield, which they found to the tune of several hundred billion in the profitless shale patch.
Needless to say, when the impending worldwide recession causes the usual level of petroleum demand destruction and prices again collapse in global oil markets, the domestic shale industry will be left high and dry.
That is, with drastically intensified negative cash flows, and nowhere to get the capital to pump water, sand and chemicals down the well bore, which are needed to hold-off the drastic production decline rates that will otherwise ensue in the tight sands .

The same story materialized in yesterday’s report on new single family home sales. At an annual rate of 607,000, January sales were actually below the 617,000 level recorded during the Donald’s first full month in office (February 2017), and miles below the old pre-crisis levels of 1.3 million recorded in 2005-2006.
Once again, the only way the present condition of the new housing market can be considered “booming” is via a false comparison with the bottom of the 2008-09 housing crash. The fact of the matter, however, is that the current 607,000 sales level was in place 27 years ago way back in the early months of the recovery from the 1990-1991 recession.
Yet back then, there were only 96 million household units (purple line) in the US compared to 128 million at present. Accordingly, the ratio of new home sales to total households has sharply deteriorated, and is actually at the lowest level ever recorded.
Moreover, the tepid recovery in unit sales which has occurred pretty closely tracks most of the other main street economic data. That is, after a healthy bounce from the depths of the Great Recession, activity levels have now plateaued and are rolling over once again.

As we have frequently indicated, the Trumpian Boom was little more than some export pull forwards, inventory building and consumer savings drawdowns during Q2 and Q3 last year—-all transient factors layered on top of the global commodity/trade cycle rebound that was well underway when the Donald took the oath.
Ironically, as he lathers up his twitter keys for boasting about his upcoming phony trade deal with Xi Jinping, the Donald actually should be thanking the Red Emperor for even the apparent substance of the Trump Boom.
That is to say, in the 2016-17 run-up to Xi’s coronation at the 19th Party Congress in October 2017, Beijing left nothing to chance, pumping one more credit booster shot into the debt-logged Chinese economy.
The purpose was to insure smooth sailing into the quadrennial confab of China’s ruling party. But as usual, the trillions of new credit flowing into the Red Ponzi, in turn, propagated waves of production, commodity inflation and trade out into the broader China supply-chain and from there to the world economy which ebbs and flows to its undulations.
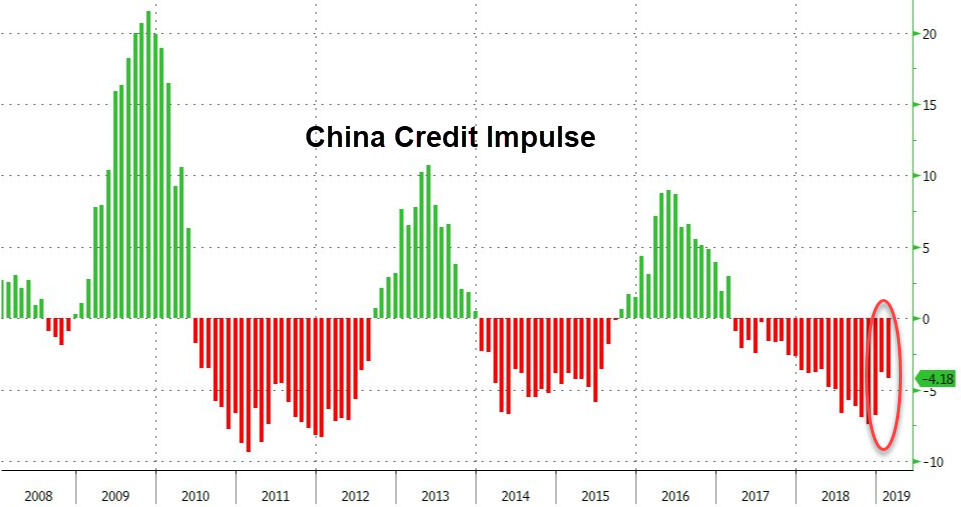
Indeed, when the US economy was growing at a temporary 3-4% rate during the middle quarters of 2014, Obama had no more claim to brag about his growth policies than does the Donald today. That particular mini-cycle of moderate economic acceleration was rooted in the same source—-the huge credit impulse unleashed by the Red Ponzi during 2013.
Needless to say, it didn’t last. After having grown at a 4.0% Y/Y rate in July 2014, US industrial production steadily weakened, bottoming at a negative 4.0% Y/Y rate in January 2016, thereby bringing overall GDP growth to nearly stall speed.
The rebound driven by China’s 2016-17 credit impulse happened along at just the right time for the Donald, of course. It caused US industrial production to temporarily hit a 5.7% Y/Y gain in September 2018.
Now, however, it’s back down the hill again, as the US economy heads toward stall speed once again in Q1 2019.

In any event, it turns out that Red Stimulus is ultimately no more efficacious than the Keynesian kind practiced on this side of the Pacific. Ever since the 2008 global credit, production and trade crisis, each successive wave of credit stimulus in China has produced a weaker response.
As shown in the chart below, China’s former double digit rates of industrial production growth are now well in the rearview mirror. In fact, for the last 55 months running the rate of gain has been under 8% and is now at the 5% line and continuing to drift lower.
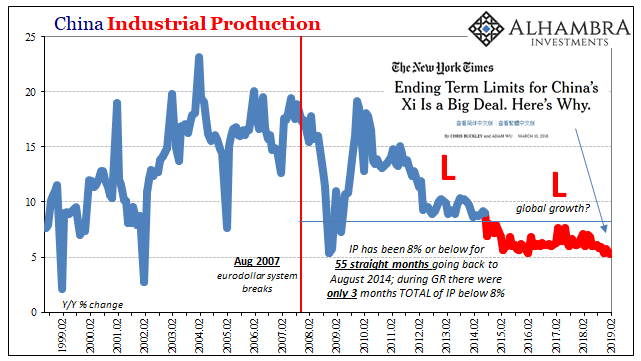
Needless to say, the Red Ponzi is capitalism in form, not substance. The Red Suzerains of Beijing have managed to stay in monopoly and authoritarian power by what amounts to “printing” GDP via centrally generated and allocated credit spending on industrial and infrastructure fixed assets.
Indeed, the most important of the dubious gifts that Beijing borrowed from the West was Keynesian GDP accounting, which is based on the principle that if you build pyramids from coast to coast with fiat credit, you will record a passel of GDP during the current period.
Stated differently, Keynesian GDP accounting is based on only a slight variation of the old scam that if “you build it, they will come”.
In this case, the only variation is that if you build empty apartment buildings (of which China has 60 million units), empty airports, empty train stations and uninhabited cities, it counts as GDP; and it means the local cadres get credit for delivering their GDP quotas.
When this whole house of cards eventually collapses, of course, they will wonder why anyone thought China was the greatest growth miracle since the Pharaoh’s pyramid building campaigns or the splendor of Louis 14th’s massive construction project at Versailles.
But in the interim, China’s manic construction and investment sprees do propagate out into the global economy—even as the gains in fixed asset investment become steadily weaker.
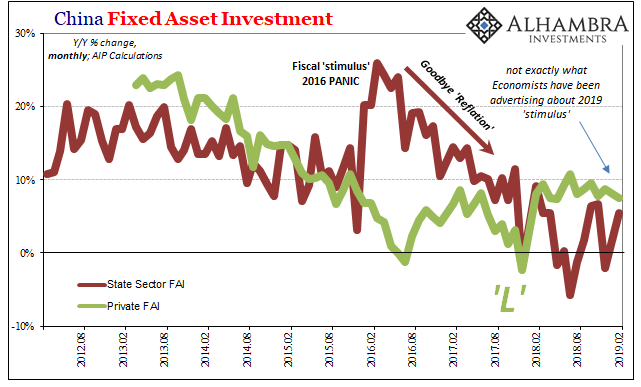
Of course, the going theory is that no one really believes you can allocate 45-50% of GDP to fixed asset investment forever—-as per the aberrant trend that accounts for China’s boom; or that you don’t have to pay the piper by generating returns on these massive investments someday in the bye-and-bye.
But they have a theory on that too—which is most definitely not materializing. Namely, that China will grow into its vastly oversized infrastructure suit just like some skinny kid who inherited the Sunday best of his 300 pound grandfather.
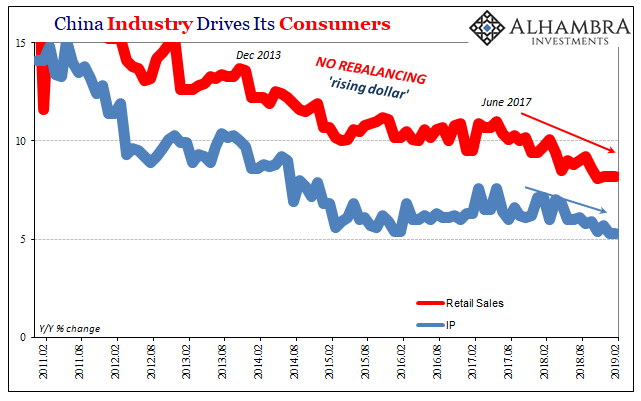
In this case, it was supposed to be a transition from an investment and export based economy to one based on the Almighty Consumer, American-style. Known as “rebalancing”, the theory made all the sense in the world—that is, as long as the consumers of China could be stuffed with fiat credit, as well.
But with $40 trillion of debt that is visible and counted and potentially trillions more that is hidden and opaque, the rebalancing is not happening because even Beijing has recognized that it has created a debt monster.
What that means, of course, is that the Red Ponzi is more like the shale boom in the Permian Basin: If the credit stops flowing–so will the oil there and the consumption spending in China.
The last four months thundering 10-20% collapse in auto sales in China is undoubtedly just a foretaste of things to come.
That get’s us back to the Fake Budget side of the matter. The Donald’s Fake Boom, in fact, was just the last gasp of Xi’s coronation-driven credit impulse. But that’s all in the rearview mirror, meaning that the US economy—now in the month #116 of the weakest and second longest expansion in history—is sitting cheek-by-jowl with its next appointment with Recession.
So if you want to understand the real evil flowing from Keynesian central banking, just consider the surreal complacency in Washington today about the nation’s metastasizing fiscal mess in the context of this foreboding macroeconomic backdrop.
In effect, there is not a care in the world about it anywhere inside the beltway, owing to the nearly catechistic belief that we have had giant deficits for years and nothing bad has happened.
Well, of course nothing bad has happened when these deficits were being monetized hand-over-fist by the Fed and other central banks.
In an honest bond market driven by supply and demand, of course, the relentless supply of new government debt over the last two decades would have caused rising rates and a crowding out of private investment. But that has been short-circuited by central bank sequestering of trillions of government debt and related paper on balance sheets funded with liabilities plucked from thin air.
Accordingly, the carry cost of government debt has plummeted, thereby euthanizing politicians inclined to borrow and spend so long as the adverse consequences did not impact constituents, such as homeowners seeking mortgages and businessmen seeking to borrowing funds for working and fixed capital investment.
A simple juxtaposition of the real rate of interest in the benchmark 10-year Treasury Note makes the story abundantly clear. During the 20 years between 1980 and 2000, for example, the bond spread over inflation consistently averaged 200-300 basis points, and there were virtually no periods during which the real yield turned negative.

By contrast, during the last seven years, bond yields have frequently been negative in real terms, and have averaged barely 50 basis points over the entire period. In effect, government borrowing was relatively pain free—so Washington borrowed with nearly reckless abandon.

So when we were interviewed by two thirty-something anchors on Hill TV this morning, we pointed out the sheer insanity of Trump budget’s $4.1 trillion of proposed deficits for just FY2020-2023; and that the very idea of it was an insult to fiscal intelligence owing to the fact that those four years are so late in the business cycle that they constitute economic terra incognito.
That is, they would cover months #123-#171 of the current aging business expansion, but we have never been there before because the longest expansion in US history was the 119 month recovery during the far more propitious environment of the 1990s tech boom.
So with recessions not having been outlawed by the UN and the sheer calendar probabilities at work, there is a virtual certainty that a downturn will strike sometime before the end of FY 2023, which would send the proposed $4.1 trillion of red ink erupting far higher, as we will document further in Part 4.