As we noted in yesterday, Elon Musk has never had two dimes to rub together from Tesla’s operations, having posted $5.8 billion of negative free cash flow over the past nine years, and upwards of $10 billion of red ink when you exclude the green hostage payments to Tesla from the other car makers and emitters.
So the fact that Tesla was able to tap the capital markers for $40 billion of fresh debt and equity over the 2012-2020 period tells you all you need to know. To wit, the Fed and other central banks have completely destroyed honest price discovery and perverted the capital markets beyond recognition.
What you have now is a wild west casino inhabited by reckless gamblers—both carbon and silicon based—that has become a destructive fount of malinvestment. And the latter is why solid economic growth has nearly vanished and the middle class has become a shrunken shell of its former self.
Stated more baldly,Tesla is a giant malinvestment and sump of wasted capital, abetted by huge fiscal subsidies (including the generous state and Federal EV tax credits and nearly $4 billion of green energy regulatory credits) and central bank fostered speculative mania.
Accordingly, it amounts to an incredible $817 billion totem of cultist speculation that would have been bankrupt years ago on the free market. The estimable Bill King got it right in this morning’s post when he averred that—
It is deplorable and depressing to see the Fed, the Street and US Regulators desecrate the US stock market by allowing and fostering an unchecked speculative mania of historic proportions.This cannot end well.
Indeed, notwithstanding essentially free capital and losses per vehicle sold which exceeded $1,400 in 2020, the Tesla dominated EV market (including plug-in hybrids) in the US still amounts to hardly a pimple on the rear-end of the overall auto market.
EV sales peaked at 358,000 units in 2018, which accounted for just 2.1% of the 17.3 million light vehicle sales, and has fallen modestly during 2019 and 2020 (2020 unit sales of 328,000 not shown)
Moreover, with EV tax credits expiring, sales by auto companies other than Tesla have never amounted to a hill of beans and are now declining sharply.
EV Sales In USA Excluding Tesla:
- 2018: 160,000;
- 2019: 142,000;
- 2020: 124,000

In the case of Tesla, overall USA sales were relatively flat over the past three years, but only because of new model introductions—the Y model in 2020 and Model 3 in 2018. Yet without its massive take-down of new capital from Wall Street, none of these new models would have been developed, while Tesla’s deliveries of its legacy Model S and Model X have stagnated.
Tesla EV Deliveries in the US:
- 2018: 197,500;
- 2019: 195,100;
- 2020: 204,000
The chart below is for worldwide deliveries, but it reinforces the point dramatically. Namely, without the tens of billions of speculative capital raised on Wall Street after 2015, the yellow bars (Model 3) and red bars (Model 3 plus Model Y in 2020) would not have happened. Tesla’s volume attributable to the Model S and Model X (SUV) would have remained negligible, meaning that it would have perished from lack of cash, profit or prospects long ago.
Needless to say, the harm goes far wider than the rank injustice of the nearly $800 billion windfall to Tesla stock owners and speculators, who as recently as June 2019 owned a company with a market cap of just $33 billion.
That’s because these kinds of massive but baseless stock market gains are contagious and encourage momentum traders (and robo-machines) to pile-on, as was so dramatically illustrated by the Reddit short-squeeze eruptions during the latter half of January.
The result is that either—
- zombie companies which should be liquidated are able to attract rescue funding packages from lenders desperate for yield; or
- start-ups which have dubious prospects or no prospects at all are able to rapidly expand as “burn babies” so long as the bubble keeps inflating and, like Tesla, they can access endless amounts of cash to fund a simulacrum of a valid business operation.
Tesla Market Cap (Billions $)

As occurs at all blow-off tops, however, the flow of capital into loss-making companies—old and new—has now reached hideous proportions. That’s evident in the case of the Russell 2000 index (RUT), which has gone absolutely vertical, rising by 51% since November and nearly 111% from its post-Covid low.
But here’s the thing. Upwards of 40% of the 2,000 companies in the index are loosing money, and many of them have been perpetual cash burn babies, kept alive by speculative capital.
Accordingly, at the present time the LTM PE multiple for the RUT is infinite because the companies as a group have posted a net loss. Indeed, the progression from a year ago is a screaming testimony to the momentum driven mania now at large on Wall Street.
In early February 2020 (before Covid) the the RUT index stood at 1465, which represented a frisky 40.5X its LTM earnings of $36.11 per share. And those earnings, it should be added, were the GAAP kind which must be certified to the SEC by CEOs and CFOs upon penalty of prison time.
By contrast, today the RUT hit 2290 or 56% higher with no trailing earnings at all!
That’s right. The only thing the WSJ market page has to publish for the RUT is the Wall Street projected one-year forward earnings of just $34.98 per share.
That’s the sell-side ex-items hockey stick version of “earnings”, of course, but as flimsy and subject to downward revision as it is, it still implies a 65.5X price-earnings multiple.
In a word, that’s just flat-out nuts, as is the RUT’s vertical ascent in recent weeks shown in the chart below.

Nor are the small and mid-cap companies which comprise the RUT the entirety of the excess. The total US market cap represented by the Wilshire 5000 index (blue line) has now reached nearly $42 trillion or 194.9% of GDP, an all-time record,
That compares to 158% of GDP in February 2020 and 130% of GDP at the dotcom blow-off top in 2000.
In fact, at the time the Wilshire market cap was just $13 trillion, meaning that it has gained more than $30 trillion in value during a period when real GDP growth has slowed to just 40% of its historic rate, and nominal GDP has risen by barely $11 trillion.

And that gets us to the ultimate bubble. As the wag said, “Bitcoin is Tesla without the cars.”
Yes, blockchain technology may well have a shinning future and we are all for money that cannot printed and debauched by the madmen domiciled in the Eccles Building.
But to paraphrase Senator Lloyd Bentsen’s famous quip to Dan Quayle in the 1992 vice presidential debate: Once upon a time we knew real money, and bitcoin is not it.
For one thing, it has no particular advantage as a medium of exchange in the computer age where all payment systems are being automated, digitized, scanned and put on-line. Bitcoin can process 4-6 transactions a second, for instance, while firms such as Visa/ MasterCard can process around 1500-2000 transactions a second. So Bitcoin has a scalability issue that would potentially limit it from becoming a widespread medium of exchange or at least one without any particular advantage.
More importantly, however, money is supposed to be a store of value, and Bitcoin most surely does not meet the Lloyd Bentsen test.
You do not have a store of value when you set off for the car dealer’s lot with your Bitcoins, but do not know whether you will be purchasing a half of a car or two cars when you get there.
Cutting to the chase, the chart below has nothing to do with a new money. It’s just rank speculation.
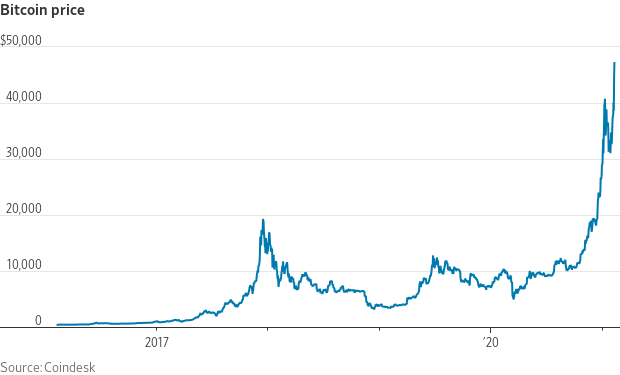
And the nearly 40X gain in the Grayscale Bitcoin Trust since 2017 tells you all you need to know. This is just another playground for the homegamers and speculators that will end in tears.

And that brings to mind the third leg of our unholy trinity. The hottest mutual fund this time around the barn is run by a pied piper named Cathie Wood.
Since its launch in October 2014, her ARK Innovation fund, the firm’s largest fund, has delivered an average return of 39% annually. And in a full-fledged mania, money chases performance.
Accordingly, whereas ARK managed just $11.4 billion at the end of March 2020, by year-end that had swollen to $58.2 billion!
Among the earliest institutional investors to buy both Tesla stock and bitcoin, Ms. Wood is a true-believing evangelist for assets she believes are on “exponential growth trajectories.”
Of course, nothing stays on a exponential growth trajectory for long,
“Not concerned about it,” says Ms. Wood. “I mean, Tesla a year ago was 10 times smaller than it is today.” (Tesla Inc.’s total market value was $77 billion at year-end 2019; this week, it exceeded $810 billion.) “That’s telling us, reinforcing our sense, that the market is beginning to understand the exponential growth opportunities out there,” which will create ample liquidity over time, she says.
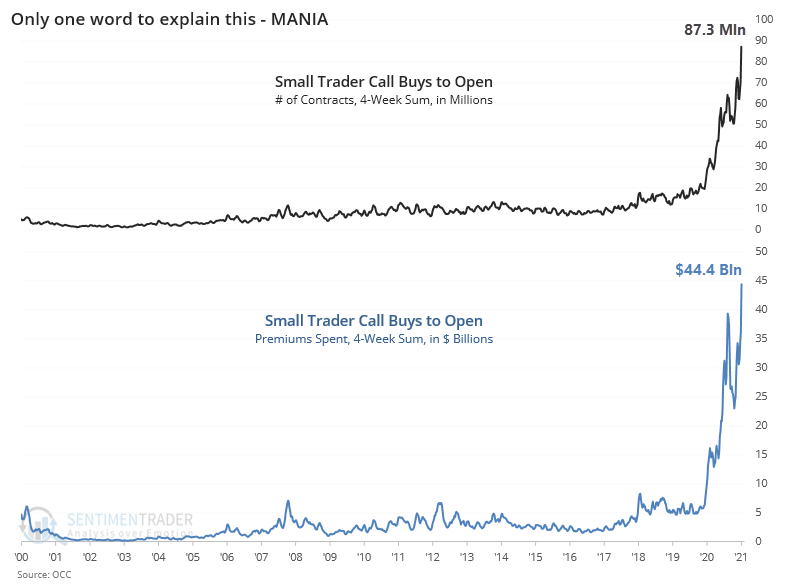
Right. But as the caption says, there is only one word to explain Ms. Wood’s vision, as well as the charts below: MANIA!
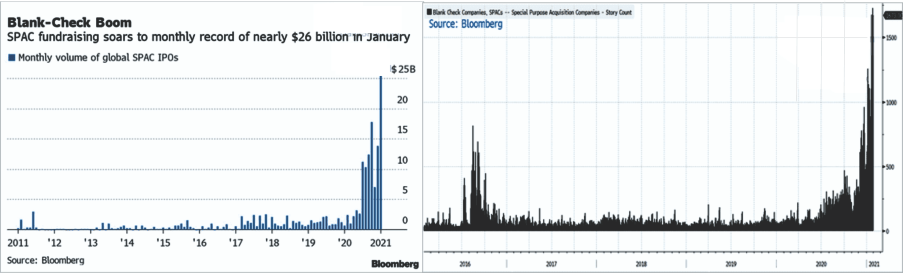
$26 billion SPAC boom in January alone: