The only positive thing Sleepy Joe had to say last night was that he had created a record 6.7 million new jobs during his first year in office, but even that was a lie. The 149.162 million jobs figure reported for December 2021 was actually 107,000 below the level of jobs the Donald had “created” as of August 2018 (149.269 million).
Of course, neither of these hot dogs had anything to do with “creating” jobs. Businessmen, investors and entrepreneurs operating on the free market do that—even as government endlessly throws regulatory, tax and Nanny State obstacles in their path.
But in this case, Biden’s claims were especially egregious because every single one of those 6.7 million slots were “born again” jobs—jobs that had existed a few years back and were just now being recovered from the government-imposed Lockdown disaster of 2020.
In fact, the more relevant point is that at the end of Biden’s first year there were still 3.34 million fewer nonfarm payroll jobs than existed at the February 2020 pre-Covid peak. That is to say, we still have a goodly amount of born-again jobs to recapture before anyone can claim “new” jobs, even if they had nothing to do with them.
Total Nonfarm Payroll (NFP) Jobs, August 2018-January 2022

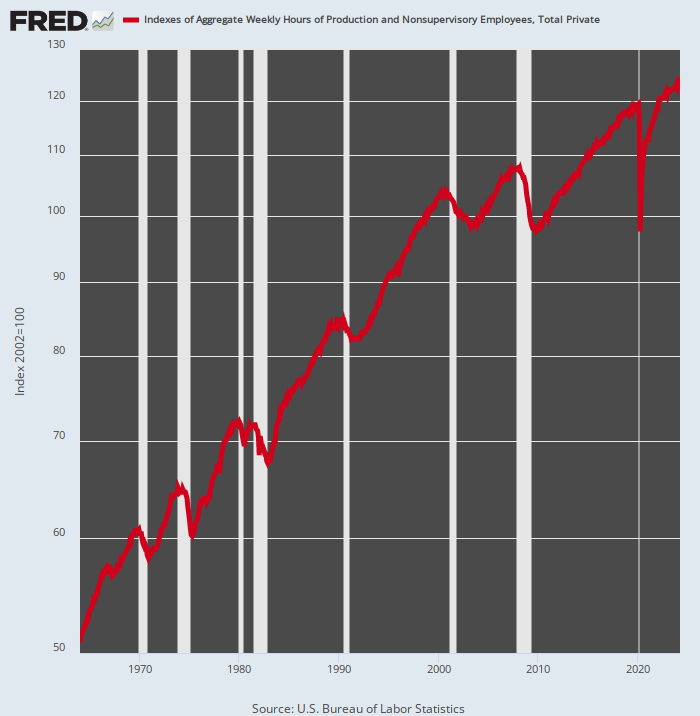
Needless to say, these NFP based numbers themselves are inherently flattering because they treat 10 hour per week hamburger flipping jobs and 50 hour-per week (with overtime) coal-mining jobs as economic equivalents. That’s rank nonsense, of course, and is the reason we follow the index of hours worked rather than BLS guesstimates of payroll slots.
And that tells an altogether different story. Total hours worked in the US private economy are still 2% below their February 2020 peak, and, more importantly, represent a tepid 0.4% per annum growth rate since way back at the pre-crisis peak in December 2007.
For want of doubt, consider that the total private hours worked index rose by 2.0% per annum for the 37 years between January 1964 and September 2000. That is to say, the true “jobs” growth rate has plunged by 80% from its historic average, yet this senile clown stood before the Congress last night pretending to be god’s gift to the working man.
Index of Aggregate Private Hours Worked, 1964-2022
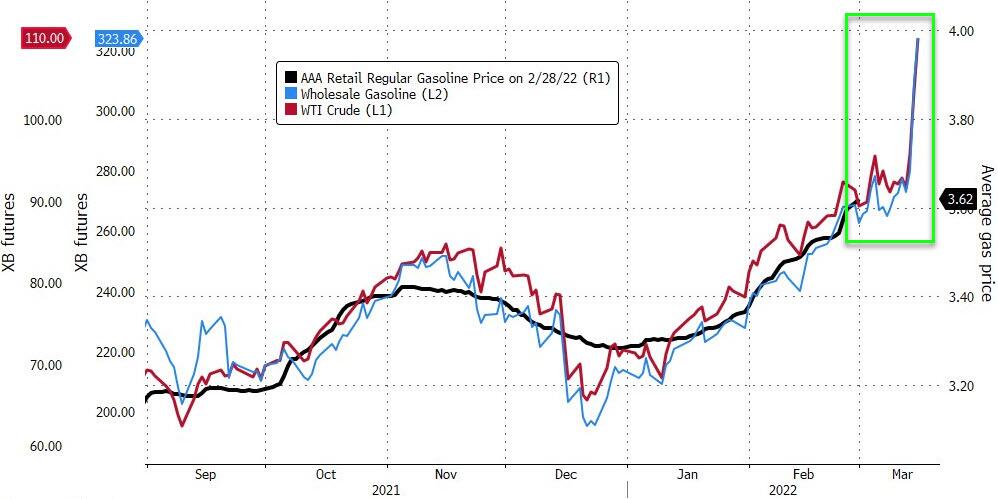
We doubt whether the working man is buying. Not with inflation raging and gasoline now hitting $4 per gallon.
Of course, the blue line in the chart below is actually a lagging indicator. It takes months for rising crude prices to work their way through the refining and distribution system and all the way down to the gas pump.
That is to say, the chart below does not include the impact of Joe Biden’s War Games. Today alone they have sent Brent Crude above $112 per barrel, and the rise is just getting started. That’s because the sanctions will soon cause the marginal supply o global oil, which comes from Russia, to crater, even though it is not embargoed per se. It seems that no one wants to transport, insure, store or take delivery!
Brilliant, Secy Blinkey & Co. Just brilliant!
Meanwhile, Chairman Powell’s congressional testimony this morning proved once again that lying, double-talk and blatant data manipulation may be a Joe Biden specialty, but at bottom it’s apparently an occupational hazard in the entire Imperial City. After all, who could say this with a straight face:
At the Federal Reserve, we are strongly committed to achieving the monetary policy goals that Congress has given us: maximum employment and price stability. We pursue these goals based solely on data and objective analysis, and we are committed to doing so in a clear and transparent manner so that the American people and their representatives in Congress understand our policy actions and can hold us accountable.
Let’s see. Powell joined the Fed in May 2012, and the value of the dollar since then has plunged by nearly 20%.
So stability, my eye! In exactly one-working generation (33 years) the dollar would loose 50% of its value under JayPo’s definition of “stability”, and yet the lunkheads on the Congressional committee sat there blaming meat, pharmaceutical and energy monopolies for inflation, if they were Dems, and Biden, if they were Republicans.
Are these people truly brain dead? They have permitted the Fed to seize the most spectacular chunk of unaccountable financial power in recorded history, yet have no clue how that has led to the massive asset bubble and roaring goods and services inflation that now hangs over the US economy like an economic Sword of Damocles.
Purchasing Power Of The Dollar Since Jerome Powell Joined The Fed In May 2012

Once he got started, of course, Powell’s verbal tsunami of lies and whoppers never stopped coming. According to the Fed chairman, in fact, we have a rip-roaring economy—and especially thanks to all those stimmies:
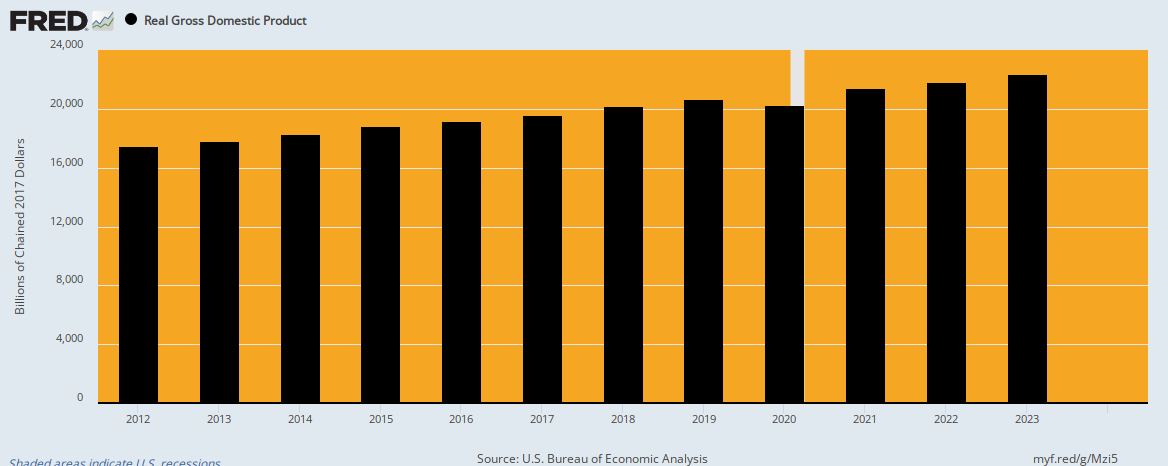
Current Economic Situation and Outlook: Economic activity expanded at a robust 5 1/2 percent pace last year, reflecting progress on vaccinations and the reopening of the economy, fiscal and monetary policy support, and the healthy financial positions of households and businesses.
Well, as for the GDP, did he also not mention that it had plunged by -3.4% in 2020. So not withstanding the massive monetary and fiscal stimmies, most of last years 5.5% gain (@ 65%) was “born again” GDP, not new economic activity or society wealth.
On a net two-year basis, therefore, last year’s gain amounted to 1.03% per annum, a far cry from even the modest 2.29% per annum GDP gain that had prevailed between Q4 2012 and Q4 2019.
Real GDP, 2012-2021
As for the “healthy” financial conditions of households, we don’t see it. Well, unless you were born yesterday.
To wit, before the era of radical financial suppression and negative real interest rates, the ratio of household debt to wage and salary income was about 83% (1971), and had reached only 121% by 1987 when Greenspan launched the modern era of massive money-printing.
After that, of course, it was off to the races. By the eve of the financial crisis in Q3 2008, the ratio had soared to 222%, and self-evidently helped to trigger the economic collapse that ensued thereafter. The more important point, however, is that the slight reduction to 167% since then (Q3 2021) is not a sign of returning health, but imminent danger.
That because all of that household debt of $17.5 trillion will refi over the next several years at higher and higher average interest rates. That means, in turn, that the real carry cost of the current household debt burden will become increasingly onerous as the Fed is forced to normalize interest rates.
And in that respect, isn’t it about time to call a spade a spade? Owing to the latest economic time-bomb from Washington—the massive sanctions war on global supply chains and payment systems—there is not a snowballs chance in the hot place that inflation will peak below 10.0% per annum. So exactly who will be buying the 10-year UST at even a 5.0% yield when the inflation rate is 10% and the Fed is selling debt per its promised next round of QT (balance sheet shrinkage).
Stated differently, these cats in the Eccles Building are in for a whole lot of surprises on the “normalization” front. And among them will not be the fact of a “financially healthy” consumer.
Household Debt Versus Wage And Salary Income, 1971-2022

The same goes for business debt, which now also stands at a record $18.2 trillion, which compares to $10.7 trillion on the eve of the Lehman meltdown and $3.0 trillion when Alan Greenspan first shuffled into the Eccles Building in Q3 1987.
To be sure, big numbers do not tell the whole story on their own, but relative to GDP they certainly do. And as shown in the chart below, business leverage versus national income has been on an upward trajectory for the better part of four decades:
Total Business Debt As % Of GDP:
- 1971: 47%;
- 1987: 62%;
- 2008: 73%;
- 2020: 82%
Nor is this the half of it. When debt is used to purchase productive assets, it’s at least arguable that it will generate economic returns down the road that will offset in whole or part the increased carry cost coincident to a permanently higher debt level.
Of course, the overwhelming share of the $7.5 trillion gain in total business debt since 2008 went for just the opposite: Financial engineering in the form of massive stock buybacks and vastly over-priced M&A deals, most of which penciled out only because of cheap debt, not true economic synergies.
Total Business Debt As % of GDP, 1971-2020

At the end of the day, the Fed has become a Puzzle Palace of nonsensical groupthink, blatant double-talk and rank self-contradiction. Here is Powell’s closing argument and it does not reflect the thinking of someone operating in the real world.
Monetary Policy: We understand that high inflation imposes significant hardship, especially on those least able to meet the higher costs of essentials like food, housing, and transportation.
(But) we know that the best thing we can do to support a strong labor market is to promote a long expansion, and that is only possible in an environment of price stability (how’s that’s for circularity ?).
The Committee will continue to monitor incoming economic data and will adjust the stance of monetary policy as appropriate (appropriate, says who?) to manage risks that could impede the attainment of its goals.
The Committee’s assessments will take into account a wide range of information (sure thing!), including labor market conditions, inflation pressures and inflation expectations, and financial and international developments.
We continue to expect inflation to decline over the course of the year (transient again) as supply constraints ease and demand moderates because of the waning effects of fiscal support and the removal of monetary policy accommodation.
But we are attentive to the risks of potential further upward pressure on inflation expectations and inflation itself from a number of factors. We will use our policy tools (i.e. the ones which has created the current disaster) as appropriate to prevent higher inflation from becoming entrenched while promoting a sustainable expansion and a strong labor market.
In short, the nation’s financial system is being run by a clueless gas bag.
So we’d guess the American people have something more dangerous to worry about than Vlad Putin’s border redrawing exercise on his own doorstep.