There is now no doubt about it. The Donald has morphed into a muddleheaded monetary nincompoop—yet his unprecedented Fed attacks are coming when the S&P 500 is at an all-time high and the GDP printed at 3.2%, whether real or not.
So we can scarcely imagine what will happen when the market crashes and the first waves of recession begin to lap onto the headline GDP numbers (they’re already there under the hood).
Still, here is the sheer clap-trapery he unloaded into the Twitterverse a few hours ago:
China is adding great stimulus to its economy while at the same time keeping interest rates low. Our Federal Reserve has incessantly lifted interest rates, even though inflation is very low, and instituted a very big dose of quantitative tightening. We have the potential to go…up like a rocket if we did some lowering of rates, like one point, and some quantitative easing. Yes, we are doing very well at 3.2% GDP, but with our wonderfully low inflation, we could be setting major records &, at the same time, make our National Debt start to look small!,
This is such a potpourri of bluster, confusion, error and inanity that its difficult to know where to start. But let’s take the “wonderfully low inflation” part of it because apparently he hears that from his professional economic advisors cheerleaders, as well
For the moment, let us assume that the price of food and energy doesn’t matter much to real people and, therefore, examine the measuring stick called the CPI ex-food and energy. On a year/year basis it has actually averaged 2.02% per annum since March 2017, and has actually been accelerating slightly in recent months.
This undoubtedly is some kind of “wonderful” if you are a leveraged real estate developer speculator; and it’s apparently close enough to nothing for the bulls of Wall Street and the pols of Washington who always and everywhere look for reasons for the central bank to monetize more debt and goose risk asset prices by “whatever” means it takes.
If you are a saver, however, it’s not all that wonderful. In fact, at the prevailing 2.02% inflation rate,$1.00 saved today by a 25-year old will be worth just 43 cents when he/she reaches retirement age of 67.
Yet there seems to be good evidence that capitalism thrives best when there is abundant real money savings from private incomes; and there is also plenty of empirical evidence that the ultra-easy money of the present era—which the Donald demands get even easier—has been savaging savers for the better part of this century.
Change From Year Ago: CPI Ex-Food and Energy

Moreover, like in the case of most economic data, what counts is the trend and where it is located in the cyclical scheme of things. In the case of the already at target levels of final CPI inflation shown above, there is actually upward, not downward, pressure building in the pipeline.
The chart below is the producer price index for goods still in the production pipeline at the intermediate stage of processing. As is evident, the index dropped by 12.5% between Q2 2014 and Q1 2016, thereby cascading deflationary pressures down the pipeline toward finished goods and helping to suppress CPI inflation during the subsequent several years.
But since the Q1 2016 bottom, the momentum has all gone the other way. The producer price index for intermediate goods has actually risen by 3.77% per annum during the period, meaning that upward pressures on prices (or downward pressures on profit margins) are now cascading through the supply chain.
We wouldn’t call these facts of life “wonderful” either, especially for the Flyover America consumer who will get to enjoy rising supermarket prices in the months ahead, topped off with an ample helping of the Tariff Man’s special form of economic goodness.

Our long time ago mentor, the brilliant and irascible Senator Daniel Patrick Moynihan, once quipped that everyone is entitled to their own opinion, but not to their own facts.
What that means in this instance, of course, is that the Donald’s “incessantly lifting” accusation doesn’t remotely describe Fed interest rate policy. In fact, it has held 102 meetings since June 2006 and has raised interest rates exactly 9 times!
If we were looking to characterize the rate increase policy embedded in the chart below, we’d use the words “rarely” and “reluctantly” to describe the Fed’s action. And we would draw an altogether different conclusion.
Namely, the unprecedented dwell time on the zero bound shown below actually gutted main street savers and retirees—even as it showered Wall Street speculators with more free carry trade money than anyone had previously imagined possible. Indeed, casino speculators actually thought they had died and gone to carry trade heaven.

Of course, the Donald might well be inclined to whine about the fact that 7 of the 9 belated and feeble increases during the last 154 months have happened on his watch.
But among other things, he surely can’t have it both ways.
That is, take credit for 3.9% unemployment at the very end of the second longest business expansion in history, which he had virtually nothing to do with, yet go on the warpath when the cowardly denizens of the Eccles Building finally get up enough gumption to begin normalizing rates; and to do it so late in the cyclical game that they can virtually see the white of the recessionary eyes ahead.
More importantly, a “one point” reduction in the Fed funds rate at this stage of the game is nothing short of madness. For crying out loud, it is just as plain as day that the trend rate of inflation is 2.00% per annum at minimum—even if you give credit to all of the BLS’ manipulations and adjustments, such as for hedonics and geometric means.
Yet the Donald wants the money market rate pushed down instantly to 1.4%.
That is to say, if the Greenspan/Bernanke/Yellen/Powell Fed has already savaged the nation’s savers and retirees, the Donald now proposes to euthanize them in one fell swoop; and that’s while he’s still under the illusion that the economy is going gangbusters.
It is doing nothing of the kind, of course, which suggests that where the single greatest monetary crank to ever inhabit the Oval Office is actually going is toward negative nominal rates (or NIRP).
That’s right. The clear implication of the Donald’s afternoon tweetstorm directed at the in-session meeting at the Eccles Building is that if the cycle turns down, then it will be incumbent upon our monetary central planners to push interest rates below the zero bound (negative interest rates or NIRP) to rejuvenate the economy; and just for good measure, he has actually placed a NIRP devotee, Richard Clarida, on the Fed as Vice-Chairman for exactly that purpose.
Of course, there is another word for NIRP, and it amounts to government confiscation of wealth. Yet in that baleful prospect there lies a supreme irony.
Trump has surrounded himself with aging Reaganite supply-siders, and the Donald fancies himself the greatest economics President since the Gipper.
But the Donald Trump is no Ronald Reagan. The Gipper actually believed in the gold standard and would have been horrified by today’s Keynesian monetary central planning and the raging apostasy of a GOP president having in mind the confiscation of the peoples’ savings.
Yet that’s where 30 years of Keynesian economics in the Eccles Building have brought us, and the threat of full-on NIRP is actually far more imminent than the oblivious punters on Wall Street might suspect.
That’s because the US economy is weak and getting weaker—even as world production and trade threaten to drop through the flat-line.

Consider some further nuggets from under the hood of the ballyhooed Q1 GDP report.
Needless to say, in assessing the health of the main street economy we are not inclined to count transfer payments. After all, they do not reflect an underlying increase in real output and value-added—just a reshuffling of already produced income from those who earned it to the various and sundry 160 million beneficiaries of the US Welfare State.
Indeed, we are advocates of Say’s Law, which holds that production and earned incomes come first, thereby enabling consumption spending—including spending from transfer payments—to follow.
The only way to induce higher spending aside from production growth, therefore, is via reduced savings set-aides, which are ultimately anti-investment and anti-growth; or by central bank and commercial banking system generation of fiat credits—-a one-time boost to spending which is self-limited by the finite debt carrying capacity of both public and private balance sheets and the future payback of servicing costs.
Accordingly, the Donald’s economic policy cheerleaders—who claim to be supply-siders and Say’s Law men– are not giving him the bad news or are simply turning a blind eye to stay in his good graces.
To wit, the tiny 0. 59% annualized rate of real income growth (ex-transfer payments) in Q1 was the very opposite of MAGA; it was actually the weakest rate of growth in the last 11 quarters and only one-fifth of the average 2.5% rate of growth since 2012.
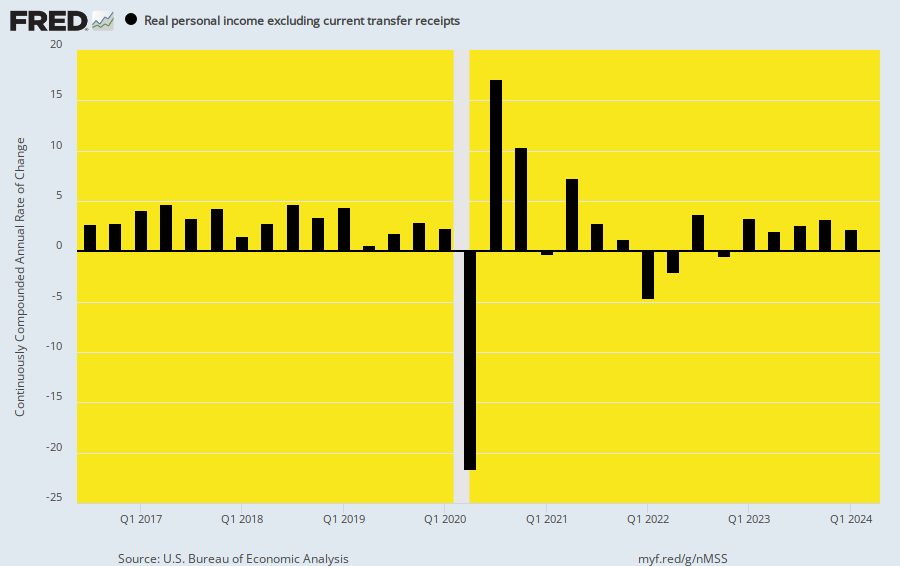
In fact, it’s still one more core metric proving the vaunted Trump growth acceleration is just talking points and short-term and reversible statistical aberrations (viz. the trade data) in the GDP accounts. Thus, the year/year rate of real income growth less transfer payments in Q1 fell to 2.17%, which was below the 2.70% nine-quarter average racked up during the Donald’s sojourn in the big Oval Office.
Except neither of these are much to write home-about. As shown in the chart below, during Obama’s last nine quarters, the average year/year growth rate was 2.75%.
To be sure, we think that latter figure happened despite Barry, not owing to his wrong-headed policies.
But the same is true of the numbers posted on the Donald’s watch: They represent the natural momentum of our capitalist economy as the business cycle ages and even as it comes up against the severe headwinds being generated by state policies—including the world’s central banks—at home and abroad.
Remove Transfer Payments From Uncle Sam—And Real Incomes Are Going South

One of those headwinds, of course, is the ever rising extraction from America’s wealth producers represented by transfer payments. Not only do they not represent “growth” (and for that reason are excluded from the above charts), but they really are anti-growth, and according to the supply-side gospel itself.
That’s because we are talking about some very big numbers and very robust rates of transfer payment growth, which ultimately come out of the hide of workers (payroll taxes) and entrepreneurs (income and capital taxes), both current and unborn.
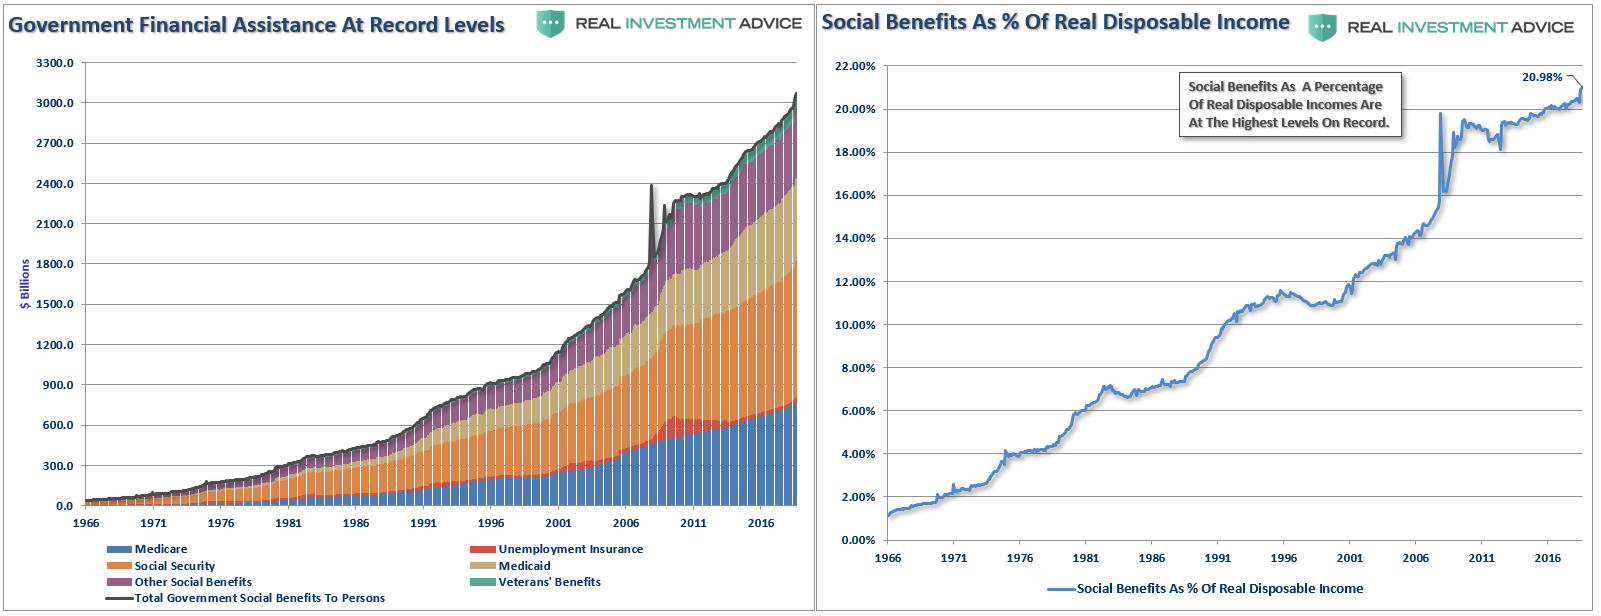
As shown below, transfer payments now total more than $3 trillion per annum and account for fully 21% of real disposable income. That’s why Keynesian economists are out to lunch when they constantly jabber about consumer spending: Actually one out of every five dollars spent by US households was earned by someone else or charged to Uncle Sam’s credit card and future workers and producers.
As is also evident from the chart, transfer payments are America’s #1 growth industry. When the Gipper entered the White House in 1981 vowing to take on the Welfare State, transfer payments in constant dollars were about $300 billion and represented about 5% of disposable income.
In the interim, however, they have grown in real terms at about 7% per annum–or nearly triple the rate of GDP growth since 1981, thereby clawing their way to the aforementioned 21% share of disposable income.
Needless to say, even as the Donald pounds the table to destroy savers and further inflate the egregious bubble on Wall Street, the Trumpite/GOP has not lifted a finger to save even a dime from the exploding rate of transfer payment spending.
Indeed, when you consider that more than 10,000 persons per day will be turning 65 for nearly as far as the eye can see, you have to wonder exactly what are they thinking?
That is, permitting the $3.0 trillion transfer payment system to soar unabated—even as they pump unprecedented money into the military industrial complex, and then into a new public infrastructure pork-a-thon, too.
That’s right. As a major report issued yesterday shows, the Donald’s proposed pork-saturated 2020 defense spending of $750 billion would amount to upwards of 40% of the $1,822 billion spent on the military by all nations on the planet in 2018; and it would dwarf the 3.3% ($61 billion) of the total attributable to the big, bad Russkies.
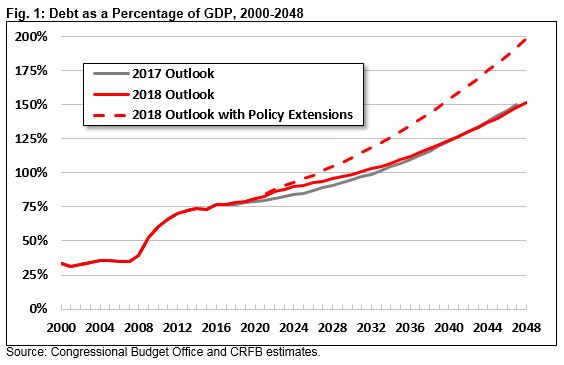
Taken together, the existing Welfare State and Warfare State spending policies–along with sober long-term economic projections–generate another $20 trillion of public debt during the next decade on top of the $22 trillion now in place. That is to say, we are heading for a public debt burden of well more than 140% of GDP.
Yet now the Donald agrees with the Dems that a $2 trillion infrastructure program would be just the ticket.
Mind you, this new $2 trillion spending plan all transpired during the course of the day. After a brief meeting with Chuckles Schumer and Nancy Pelosi, it was all smiles at the prospect of the greatest pork-a-thon that Washington has ever seen.
Mrs. Pelosi said the two sides had “come to one agreement: that the agreement would be big and bold.”
This fiscal insanity does give some inkling of why the Donald called not only for a one percentage point reduction in interest rates, but also a restart to QE.
To wit, the madman in the Oval Office apparently wishes to monetize the massive public debts that are coming down the pike, and which will swell enormously when the next unavoidable recession hits the Federal budget accounts with malice aforethought.
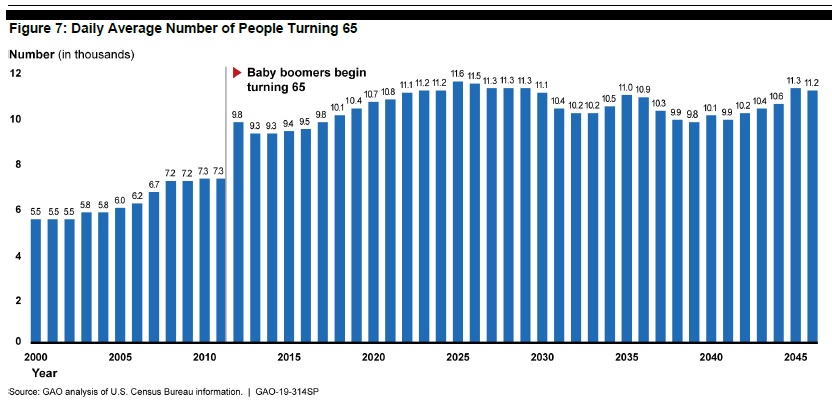
Actually, the fiscal nightmare aborning is even worse than implied by the endless march of retiring baby-boomers depicted in the chart above. The hidden secret of the American Welfare State is that its central engine—the social security and disability insurance system—is a blatant Ponzi Scheme.
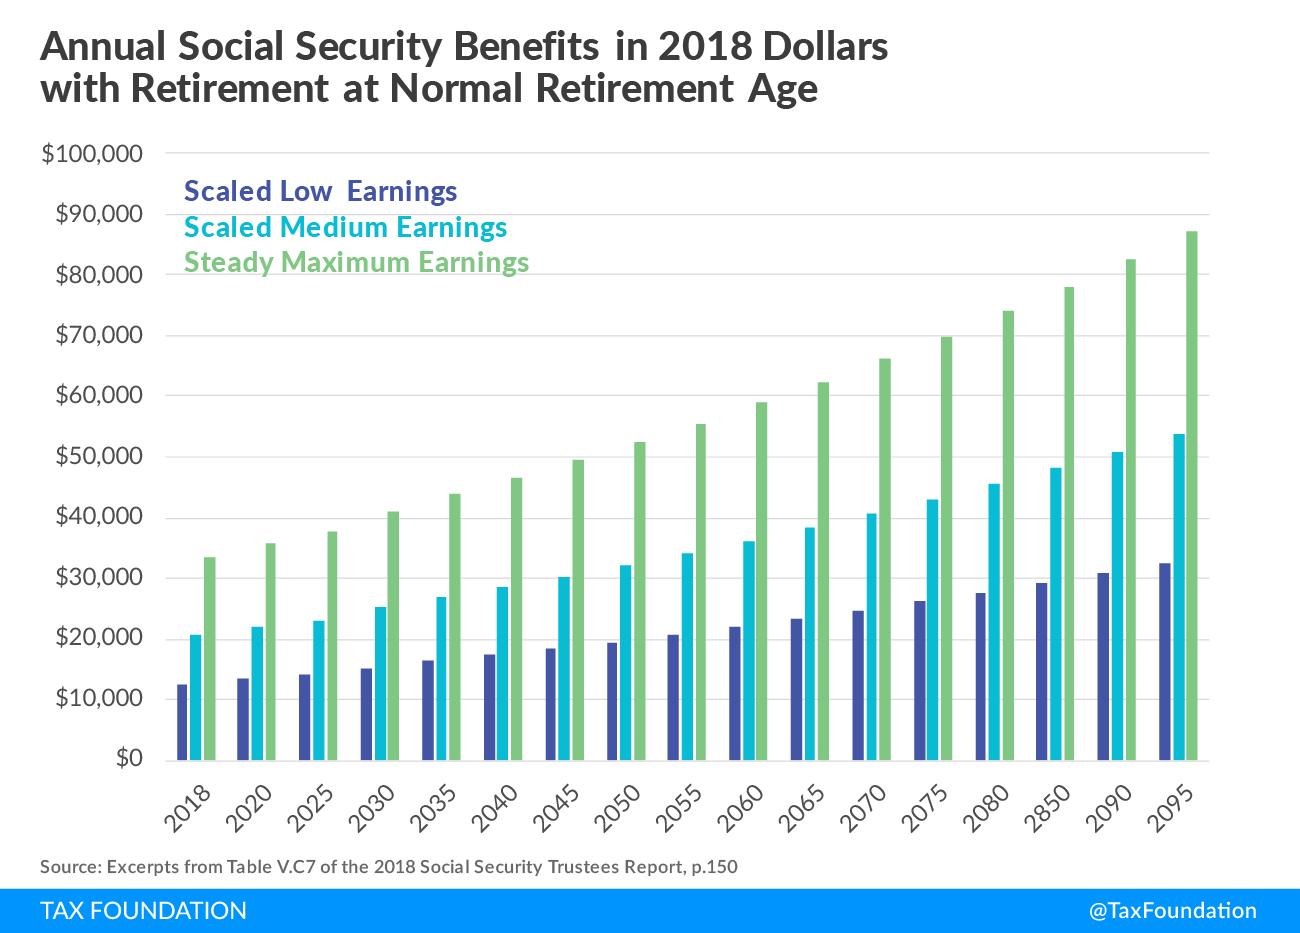
That’s because benefits are based on double-indexed lifetime wages. Not only are payroll tax payments of each worker indexed for inflation, but they are also indexed for real wage growth. Accordingly, the payroll taxes contributed by 25-year old workers today will reflect economy-wide wage growth for the next 35 years!
What it adds up to is a dead end. As shown below, in constant dollars, the average benefit of a medium earner will rise from $20,000 per annum at present to $36,000 by 2050 and ultimately to $55,000.
The fiscal math is unforgiving. The dotted red line shows what is now baked into the cake: A debt-to-GDP trend that will actually make MABE. That is, Make America Broke Everafter.
So do we have a monetary nincompoop in the Oval Office?
Why, yes, we surely do.