We have been cogitating on the gross anomaly of our time: Namely, the fact that pre-tax corporate profits of $2.2 trillion (annual rate) posted for Q4 2018 were actually a tad lower than they were 7 years ago in Q1 2012, yet the S&P 500 has gained 125% during the interim.
To hear the talking heads of Wall Street tell it, of course, there is no anomaly at all because, why, corporate profits have been “gangbusters”. For instance, so called “operating” profits are forecasted to rise by 23% between the end of 2018 and 2020, implying hitting the buy key is a no brainer.
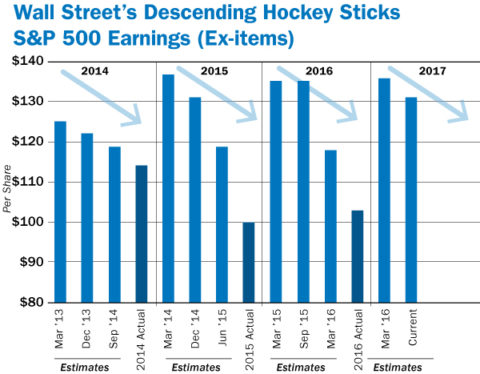
But the above numbers are just another iteration of Wall Street’s ex-items forward hockey stick, which is absolutely useless because it way overstates true GAAP profits; and it goes through a ritualized shrinking process so consistent that you could set your watch buy it.
As shown below, during 2014-2017 the initial two-year forward estimates ended up shrinking by 10-40% by the time actual 10-Ks were filled with the SEC; and that’s even after Wall Street analysts had combed through the filings to strip out all the ex-items bad stuff (i.e. asset write-offs, goodwill write-downs, facility closings, restructuring charges for severance, stock option expense, pension charges etc) so as to powder the filed pig to the maximum extent plausible, or not.
In the case of 2017, which wasn’t completed when this chart was made, the actual ex-items number for the year was $124.51 per share, meaning that it shrunk by about 10% from the original estimates.
Likewise, in March 2018, the forward estimate for December 2019 was $172.62 per share, which number has already shrunk to $164.99, and there is still nine more months of shrinkage yet to go.
The truth is, the market is always priced nearly the same in forward PE terms, which is the only valuation metric Wall Street recognizes. That’s because the earnings hockey sticks produced by so-called equity analysts and Wall Street strategist are everywhere and always 15-30% higher two years out compared to the present; and because in the entire history of Wall Street earnings forecasting, a recession has never, ever happened!
So we prefer to stick to the economic terra firma of trailing (reported) GAAP earnings because at least these numbers have been certified as accurate by CFOs and CEOs on penalty of jail time. And as we showed in part 1, when you strip out the share buybacks and tax law change you get S&P 500 earnings per share growth over 2012-2018 of just 28%—a figure not even in the same ballpark as the 125% gain in the index from 1300 to 2900.
Stated differently, that nearly seven year period was the inherent sweet spot of the business cycle encompassing month #30 to month #114 of the post-June 2009 expansion. Yet during that cyclical optimum, apples-to-apples earnings grew from $88.54 per share in Q1 2012 to $113.75 in the LTM period ending in Q4 2018, which computes to an annualized increase of just 3.8% per annum.
That begs the question as to why the casino would pay 14.6X for the S&P 500 earnings in Q1 2012, when the business cycle had plenty of time and running room ahead, but 25.5X the earnings posted for 2018 that were generated at the tail-end of the cycle by any historical standard.
In fact, the real story is worse. Pre-crisis earnings peaked in the June 2007 LTM period at just under $85 per share. That represented a 17.5X PE multiple on the S&P 500 index, which clocked in at about 1500 in mid-2007.
As it happened during the next 11.5 years, therefore, the annualized S&P earnings growth rate was a pitiful 2.58%. And for all practical purposes that’s peak-to-peak for an entire business cycle.
Let’s see. The honest injun CPI gain for the identical period was 1.75% per annum. So what we have is a 50% increase in the PE multiple over the cycle (from 17.5X to 25.5X) in the face of a real earnings growth rate of less than 1% per annum.
And that get’s us to the heart of the intellectual corruption which has become embedded in Wall Street after decades of massive central bank intervention and coddling.
The Wall Street narrative now consists of a timeless 24 month future that denies the history of business cycles and which is completely decoupled from the dismal trends that have actually been recorded.
Needless to say, when you function in rolling 24-month forward time capsule that always looks exactly the same—-economies growing, profits rising, and share prices climbing—there is no need to look back, and to notice that yawning gap between completed reality and future fantasy.
Or to even recognize that seven-years of flat profits in the GDP accounts reflect the fact that main street America has flat-lined, even as Wall Street and the financial media have lost their minds in what we have properly described as giddy flights of speculative euphoria.
So, as we also said in Part 1, the talking heads of Wall Street have become literalistic servo-trons, which cannot see more than a few days ahead and more than one paragraph deep into the incoming financial and economic news.
Again this morning, we had still another case in point with the release of March retail sales. Not unexpectedly in response to a monthly upward blip, the financial press did not spare the superlatives. Claimed the CNBC website:
U.S. Retail Sales Soared:… sales surged in March at the fastest pace since late 2017, as spending on autos, gasoline, furniture, and clothing jumped.
Actually, here are retail sales for the past 15 months, and the there is absolutely nothing soaring about them. In fact, the Q1 2019 average of $200.988 billion per month (seasonally adjusted) was actually 0.2% lower than the $201.317 billion average for Q4 2018 and the $202.385 billion posted last October owing to the post-tax cut sugar high among consumers.
All of these numbers are allegedly comparable because they are seasonally adjusted, and while we don’t put a lot of stock in the Commerce Department’s computations, the biases pretty much wash out over a 15 month period.
So how in the world could even the one month blip in March 2019 sales to $202.269 billion be described as a barn-burner when it was well below last October’s level, and that’s before you factor in inflation?
That’s also why we put the CPI in the chart on retail sales below, and present the monthly bars on a full scale basis. In combination, they tell a story which is the very opposite of this morning’s algo-generated headlines from the news side which triggered some excited buying among the algo-traders on the buy side.
The fact is, Q1 retail sales last year (2018) posted at $198.540 billion per month, meaning that the Q1 monthly average this year was up by just 1.23%. And that’s a full year’s change in nominal dollars.
What happens when we bring the CPI into the picture is not pretty. The CPI index (red bars) averaged 249.25 in Q1 2018 versus 253.31 in Q1 2019, meaning that the consumer inflation rate over the past year was 1.63% as measured by the BLS, including all of its downward adjustments of actual prices for hedonics and other technical factors.
Still, the implications are crystal clear. Inflation-adjusted retail sales in Q1 were actually down by at least 0.4% from last year, and probably more based on what consumers actually pay at the cash register.
Alas, we do not call that soaring.
Indeed, it actually implies that recession may be closer than the casino would have you believe, and that after 117 months of debt-supported expansion, the consumer is running out of gas.

Nearly an identical perversion occurred earlier this week in the case of the March industrial production numbers—especially for the manufacturing sector, which the Donald claims has come bounding back.
In this case, a small monthly drop in the index was described as a fleeting setback when, in fact, it confirmed a giant structural malady that is at the center of the failing main street economy.
To wit, not only was the March index down nearly 1.5% from last fall’s temporary peak, but it is still down nearly 2% from its peak 11 years ago on the eve of the crisis. You can’t call this a recovery because the entire manufacturing sector of the US economy self-evidently hasn’t recovered.
Moreover, if you haven’t gotten back to square # 1 after an unprecedented monetary and fiscal stimulus for the better part of a decade, and then another whopping dollop from the Trump tax cuts and spending increases last year, you have something more than a monthly blip to be dismissed, as did the talking heads earlier this week.
What you have is a main street economy which is failing and a Wall Street bubble that has essentially euthanized the gamblers, traders and robo-machines who operate there.
Moreover, as we will essay in Part 4, you can lay the responsibility for this dangerous disconnect at the front door of the Eccles Building. That’s where the extreme monetary central planning regime it practices disabled the capital markets and destroyed honest price discovery years and years ago.
