Once upon a time, the stock market reflected the state of the main street economy and the level of business profits. In the present age of Keynesian central banking, not so much.
To wit, since the first quarter of 2012, the S&P 500 has risen from 1300 to 2900 or by nearly 125%. At the same time, pre-tax corporate profits of $2.20 trillion (annualized rate) in Q1 2012 have gone nowhere at all–actually posting a tad lower at $2.18 trillion in Q4 2018; and that dismal number, in turn, was down by nearly 6% from the peak $2.32 trillion level posted in Q3 2014.
The chart below might give rise to the rash thought that something here is not on the up and up about the vaunted bull market.
And it’s not: Those allegedly booming profits behind the soaring stock averages did not arise from the main street economy, but from one-time tax law changes, Wall Street’s ex-items accounting games, massive share buybacks and the structural shift of corporate profits to the S&P sector from smaller and unlisted companies, such as happened with the massive shift of adverting dollars and profits from traditional media companies (mostly not in the S&P 500) to Google and Facebook.

What we are saying is that the booming recovery which Wall Street and the Donald keep boasting about does not reflect gains in the broader main street economy; it’s a stock index-based simulacrum of prosperity that rests on the biggest Wall Street whopper ever told.
You can start with the reported earnings per share for the S&P 500. We put the emphasize on “reported” here because that is code for GAAP earnings—or the kind of profits that must be certified as truthful to the SEC by CEOs and CFOs on penalty of prison time.
It happens that in Q1 2012, LTM reported earnings posted at $88.54 per share and represented a 14.6X PE multiple at the market’s then 1300 level. During the next six years S&P 500 reported profits rose to $132.39 per share, implying a PE multiple of 21.9X at the market’s 2900 level on the back of a 50% profit gain over the period.
So on first approximation basis, increased GAAP profits account for about two-fifths of the 125% gain in the S&P 500 index—with the dominant share of the gain owing to PE multiple expansion.
But that overstates the case considerably because the December 2018 LTM earnings of $132.39 were flattered by the huge one-time tailwind of the 21% corporate tax rate that was not in the numbers for any of the previous annual periods going back to 2012. In fact, about $10 per share of the $22 per share gain in 2018 was owing to the one-time tax cut effect that will have already anniversaried out of the numbers during the current quarter.
So on an apples-to-apples basis for corporate tax rates—which really have little to do with production and income on main street—S&P 500 earnings for the LTM period ending in December 2018 amounted to $122 per share. This implies a 38% gain in actual pre-tax profits per share.
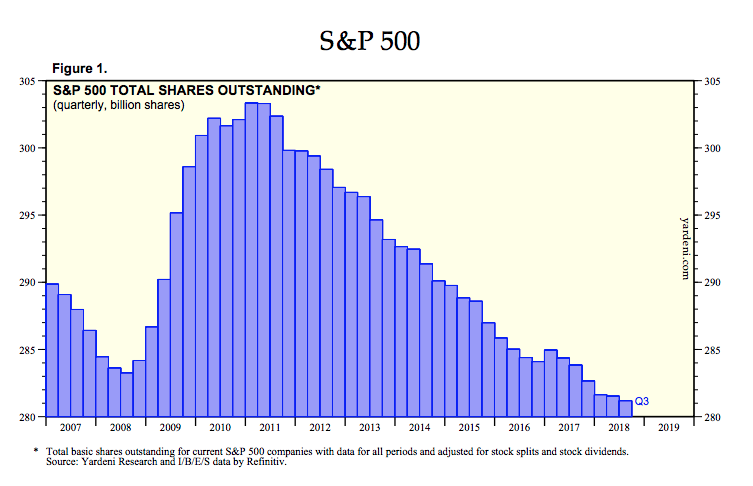
Again, the relevant qualifier is “per share”. Self-evidently, the S&P 500 companies have been buying back their shares at a furious pace, and that process went full retard in response to the corporate tax cut in 2018, with nearly $800 billion of buybacks setting an all-time record. For the six-year period 2012-2018, in fact, cumulative S&P 500 buybacks totaled $3.53 trillion—-a massive flow-back into Wall Street that took a big chunk out of the share float.

As shown below, the float of outstanding S&P 500 shares shrunk by nearly 7% between 2012 and 2018. Accordingly, on a constant share basis (2012 actual), adjusted earnings for the December 2018 LTM period would amount to just $113.75 per share. In turn, that would reduce cumulative growth over the six year period to just 28%.
Stated differently, when you take the one-time tax effects and share count reductions out of the numbers, the implied apples-to-applies PE multiple at the S&P 500’s current nosebleed 2900 level computes to 25.5X.
Yes, the tax cut did happen and the share counts have been sharply reduced—so the resulting earnings per share numbers are technically accurate. But a one-time tax reduction is a level change in the burden of Uncle Sam’s extractions, not permanent growth; and share count reductions have been purchased in corporate finance terms at the expense of increased balance sheet leverage risk and interest expense down the road.
So earnings gains from these factors do not merit standard multiples. And most certainly not at the top of the soon-to-be longest business cycle expansion in history—a condition that says future year earnings will take a deep plunge before they again re-set to the next economic expansion cycle.
In any event, even the $113.75 per share of apple-to-apples S&P earnings for 2018 and the implied 28% growth since 2012 does not really reflect overall corporate profit gains and most certainly not macro-economic conditions on main street.
That’s because certain structural changes in the US economy have had the effect of migrating corporate profits to the S&P 500 companies from the Russell 2000 and from private companies not valued on the stock exchanges at all.
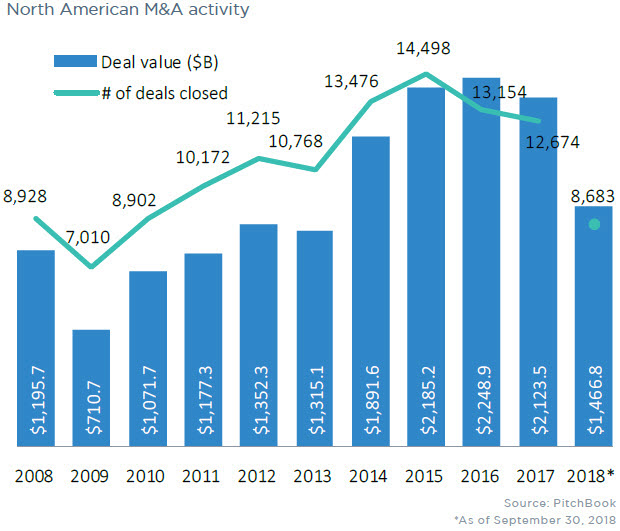
A big part of that is the massive M&A boom that has been fostered by the Fed’s money pumpers. As a general rule, the minnows don’t swallow the whales: That is to say, the Wall Street driven M&A machine has shifted the acquired profits of target companies into the S&P 500 index companies whenever non-S&P companies were acquired.
Overall, the impact has been significant. During the period 2012-2018 nearly 85,000 M&A deals with an aggregate valuation of $13 trillion were completed in North America. While it is likely that a majority of the market cap transferred in these deals was between S&P companies—still, tens of billions of annual profits were brought into the S&P index from target companies that had not been part of the index.
To be sure, that migration of companies and profits to the index which wears the big boy pants involved real economics.
But it was a transfer, not growth, in the aggregate economy. As such, it means that the path of main street prosperity and S&P 500 capitalization has been steadily diverging and not just since 2012, but during most of the past 30-years of Greenspan initiated monetary central planning.
Likewise, in 2012, the S&P 500 companies reported aggregate GAAP profits of about $860 billion, of which Google and Facebook combined accounted for a relatively minor $10.7 billion or just 1.2%.
By contrast, during 2018 Google and Facebook posted combined profits of $53 billion which accounted for nearly 5% of S&P 500 profits of $1.125 trillion. More importantly, this $42 billion gain accounted for nearly 16% of the $265 billion net income gain over the past six years by all 500 companies in the index.
In this instance, we are talking about M&A of a different kind. What got “acquired” by Facebook and Google was roughly $180 billion of advertising revenues that previously accrued to newspapers and magazine, billboard companies and radio and TV. Overwhelmingly, those ad revenues and the embedded profits had accrued to companies not in the S&P 500.
But the crucial point is this. The total ad spend is a highly cyclical, slow-growth sector. Thus, the total ad spend in North America was $185 billion at the pre-crisis peak back in 2007 and posted at just $213 billion in 2018, thereby representing a mere 1.3% annual growth rate over the period.
And that’s in nominal dollars. In real, inflation-adjusted dollars the ad spend is not really growing at all—even as a massive 40% chunk has been transferred to the big one-line ad vendors in the interim.
Once again, therefore, growth in S&P profits and the index market cap is an altogether different matter than prosperity on main street, as we shall further explore in Part 2.