Larry Kudlow was on bubblevision today spinning like a whirling dervish. The gist of his cheerleading was that “it’s working” and that today’s Q4 GDP report proved that the purported Trumpian Boom is alive and well.
Yes, and if dogs could whistle, the world would be a chorus!
So let us insist again that when it comes to short-run GDP movements, the figure to look at is real final sales. It’s the very same thing as real GDP except it removes the sometimes out-sized fluctuations in quarter-to-quarter inventory stocking and destocking, which over any meaningful period of time net to a wash.
Therefore, here are the numbers representing year-over-year real final sales change for the Donald’s first eight quarters and Barry’s last ten quarters. If you can find any acceleration in the trend over this four and one-half year period (Q2 2014 to Q4 2018), please send us your magnifying glass so that we can detect it, too.
To wit, the eight-quarter annualized growth rate for Trump is 2.64% compared to 2.47% during Obama’s last 10 quarters. And the one thing we do know is that 17 bps of difference is a rounding error, which as likely as not will be revised away entirely before the GDP numbers complete their nearly endless cycle of revisions and re-benchmarkings over the decade ahead.
We also know that hitting Uncle Sam’s already overdrawn credit card for an extra $300 billion to fund the tax cut and $200 billion to fund huge increases for defense, domestic pork and disaster relief this year (on top of the $700 billion deficit which Trump inherited) didn’t move the needle enough to be detected by the naked eye.
That is, real final sales during the four quarters ending in Q4 2017—before the tax cut and most of the deregulatory steps were effective—grew by 2.59%. Yet the four-quarter gain for Q4 2018 reported this morning was just 2.69%.
So you could say, congratulations, Donald! You borrowed an extra one-half trillion dollars last year and got 10 bps of growth to show for it.
We also know that neither the 2017 growth rate (2.59%) or 2018’s rate (2.69%) have any resemblance to a boom.
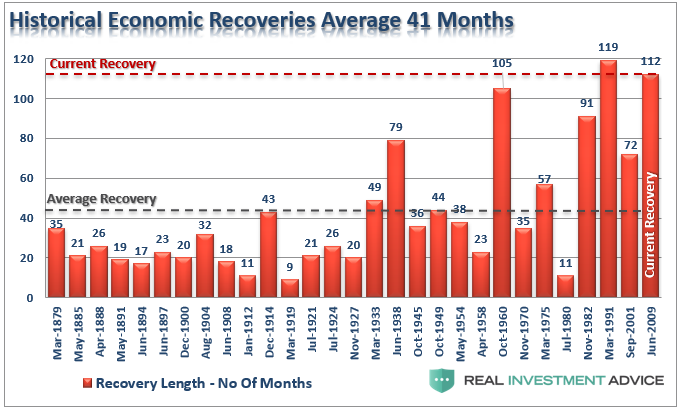
Back in the day, we actually witnessed one during the 90-month recovery cycle of the Reagan-Bush era, when real final sales grew at a 4.2% annualized rate after the recession ended in Q4 1982. And even that one paled somewhat relative to the 105 month expansion of the 1960s, when the growth rate averaged 4.7% per annum.
Needless to say, the one similarity is that both LBJ’s “guns and butter” boom and the Gipper’s Morning in America breakout were fueled by a huge increases in the Federal deficit. That is, they were not sustainable and to some considerable degree involved stealing growth from the future.
Except today the national debt is $22 trillion and but a modest piece of the $70 trillion total public and private debt being lugged around by the faltering US economy.
Self-evidently, therefore, fiscal stimulus now generates a comparatively meager boost to the tepid underlying growth rate that is being pinned down by America’s Debtberg. Accordingly, you get all the long-term pain of more permanent debt, but barely a token bit of short-term GDP gain.

What you give up, however, is time on the cyclical clock. We are now at month #116 of the post-June 2009 recovery and just three months from breaking the all-time record expansion of 119 months, which was notched when the 1990’s tech boom ended in recession in March 2001.
So as a matter of perspective, recall that the eight-quarter real sales growth rate at an equivalent point in that cycle was 4.4% annum. Moreover, that substantially more robust growth rate was achieved with no fiscal stimulus at all—–and by the lights of Keynesians an actual fiscal drag.
In fact, by the last and equivalent year of the long 1992-2000 recovery cycle, the Federal budget posted a $234 billion surplus, which back then amounted to 2.3% of GDP. In today’s economy that would be equal to a $475 billion surplus compared to the actual $1.3 trillion deficit that was added to the public debt during 2018.

That’s right. The more accurate characterization of the 2.69% Q4/Q4 growth of real final sales in 2018 was that an economy heading for its next date with recession was the beneficiary of a wildly irresponsible fiscal stick save, but one which absolutely will not be repeated in 2019 in a context where the House Dems are militantly determined to thwart and sabotage the Donald at every turn.
Indeed, as Wolf Richter pointed out today, nominal GDP grew by $1.06 trillion during 2018—notwithstanding a $1.30 trillion injection of deficit spending into the US economy.
Consequently, the proper interpretation of the 2018 GDP figures is one of out and out alarm. We have literally reached the point where Uncle Sam’s annual new borrowings are exceeding the gain in total GDP—a folly that gives an altogether new definition to the old saw about attempting to borrow your why to prosperity.

Actually, the truth of the matter is far worse. That’s because all deficits are not created equal and ones at the tail-end of the longest business cycle expansion in US history are especially perverse; and even more so in a context where the debt/GDP ratio has been racing higher on an extended trend basis and where structural factors (like the Baby Boom retirement tsunami and the normalization of interest expense on the massive public debt) are materially widening the fiscal gap on a go forward basis.
What we mean is Kudlow’s silly boasting today doesn’t even qualify as bravely whistling past the grave yard.
With Washington plunging into political dysfunction and fiscal incontinence at the tippy top of the soon-to-be longest business cycle in history, it is far past the time to be bragging about the current economy and the allegedly good data flashing in the rearview mirror; and imperative, instead, to assess the headwinds coming at the windshield and their implications for steering the vehicle.
That’s especially because the headwinds facing the current aging cycle are ferocious compared to what prevailed when the record 119 month run of the 1990s finally rolled over into recession in March 2001.
Back then, there were virtually no macroeconomic headwinds visible and considerable tailwinds from all directions. The Federal budget was in surplus; the Fed had finished its tightening cycle at a 6.5% funds rate nine months earlier; Europe was busting out of the single-currency starting gates; and the Red Ponzi was just finding its export sea legs and had only $2 trillion of debt.
Today’s circumstances are the opposite—-with massive headwinds accumulating like never before. The US Treasury will be borrowing $1.2 trillion this year; the Fed is still at a 2.40% funds rate, way behind the curve and still dumping bonds at a $600 billion rate—the recent Powell Pivot notwithstanding; the European economies are again rolling over into recession while global trade is slowing sharply; and the Red Ponzi sits precariously atop $40 trillion of debt and an economy drowning in wasteful malinvestment, hideously inflated real estate markets and inexorably slowing GDP growth.
With the cycle at 116 months of age, therefore, any of those headwinds could trigger a downturn. But in combination they make the odds of a US recession during the next 12-24 months overwhelming.
And this is where the central bank fostered cult of the stock market works its toxic spell. The world is literally on a daily SPX standard—so if the S&P 500 gains some points, or simply doesn’t crater, it is assumed on both ends of the Acela Corridor that all is well.
Trend-line analysis over any reasonable period of time has been shit-canned, and the principles of sound money, fiscal rectitude and even common financial sense itself were forgotten long-ago.
Among other things that means that short-term economic deltas are embraced like comfort blankets when history tells you they are completely meaningless. For instance, today’s annualized, seasonally adjusted real GDP gain was 2.5% and some change, but that compares to 2.5% in Q4 of 2000 and 2.5% in Q4 of 2007.
What’s of note regarding the latter two data points, of course, is that each was posted in the last expansion quarter before the recession of 2001 and 2008, respectively.
Likewise, the Wall Street cheerleaders were out calling the “all clear” because real GDP beat consensus, albeit a “consensus” that started out at nearly a 4.0% forecast for Q4 last spring; and they did so on the grounds that the labor market is still strong as per the 304,000 payroll job gain posted for January.
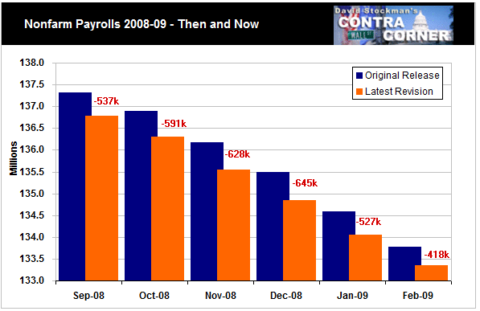
Then again, the BLS jobs count is a blatantly lagging indicator that is always a day late and dollar short in calling the cyclical turns—in the sense that after the fact revisions have been unusually large historically. For instance, during the six months after the Lehman meltdown in September 2008, the originally reported establishment survey jobs counts were revised downward by about 556,000 per month.
In any event, the average gain during the Donald’s 25 months in office, which coincided with month #90 through months #115 of the current cycle was 205,000 jobs. That actually happened to be less than the 213,000 gain during Obama’s last 25 months—so again there has been no acceleration whatsoever in job growth despite the ballyhooed Trump Boom.
But the larger point is that during the equivalent 25 months of the 1990s boom, the monthly gain averaged 219,000. And that amounted to an annualized job gain of 2.1% of total employment compared to 1.7% of today’s materially larger labor force.
Still, the rearview mirror proved nothing back in late 2000, as the US economy officially entered recession 4 months later.
At the end of the day, what the 2018 GDP numbers really told you is that the US economy has been on a fiscal and monetary respirator, and that the odds of recession on a purely calendar basis—to say nothing of the headwinds coming from all points on the global compass–are extremely high.
Accordingly, the number that was missing from this morning’s exercise in whistling past the graveyard was 6.3%. That’s the 2018 increase in the public debt as a share of GDP, and it’s absolutely off the charts of history.
It means that when the impending recession actually gets recorded, the Federal deficit will hit $2 trillion per year as revenues crater and safety net expenses soar. That means Washington will be buried in deficits equal to 10% of GDP or more at a time when the government is being run by Nancy Pelosi, Chuckles Schumer, the freshman Dem/AOC crowd and the Donald, if he survives the conflagration.
Given the doleful results reported by Budweiser today, it’s iconic slogan can perhaps be recycled to the circumstances described above.
That is to say, most definitely, This Dip’s Not For You!