At the turn of the century, even a cursory look at the demographic curves told you that the next two decades should have been an era of deferred gratification, heightened savings, preemptive investment and prudent preparation for the Twenty Twenties and beyond.
Quite simply the giant Baby Boom generation was inexorably heading for the retirement ranks and the American Welfare State for a massive eruption of cost.
What that immovable socio-economic force required, in turn, was a lean fiscal and financial posture going into the 2020s; and also a solid economic foundation capable of the consistently high economic growth rates—well above those recorded during the second half of the 20th century—that would be needed to support a metastasizing fiscal burden.
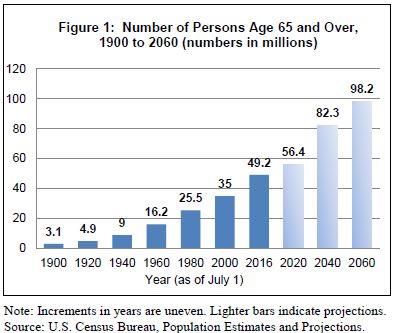
As the chart below shows, there were just 35.0 million citizens age 65 and over at the turn of the century, and that figure was already destined to climb to 49.2 million by the 2016, representing slightly more than 880,000 new retirement age persons per year.
But that was just a warm-up. By 2020 the number would grow to 56.4 million and then soar to 82.3 million by 2040 as the entire Baby Boom generation of 78 million strong matriculated to their golden years.
Accordingly, between 2016 and 2040, the 65 and over population would grow by 1.38 million per year for a quarter century running, thereby swamping the Social Security/Medicare/Medicaid/Welfare State complex with a massive and permanent expansion of the recipient rolls.
Indeed, by 2060 the 65 and over population will hit 98.2 million, but that’s not the half of it. Even more significantly, nearly two-thirds of that total will be accounted for by persons 75 and older.
That’s right. The the nation’s heaviest medical care using population will have grown from 15 million in the year 2000 to 55 million by 2060, representing nearly a 4X increase in the U.S. Welfare State’s highest cost population.
So if there was ever a time to harvest from the past and borrow from the future, if need be, it would be the coming decade and beyond. But, alas, there is precious little to harvest from the deeply impaired, debt-ridden U.S. economy now limping into the 2020s, while the headroom for significant future borrowing has already been tapped out completely.
That’s the real baleful legacy of the last two decades. To wit, America lived high on the hog—both publicly and privately—when it should have been living lean and storing up provisions for the fiscal due bill which prodigious post-war baby-making between 1946 and 1962 had long ago baked-in-the-cake; and which profligate legislators had massively enlarged between 1960 and the end of the 20th century.
So for all intents and purposes, the two decade period now ending was the last opportunity to arrest the massive spending bow wave now upon us.
But surely it is already too late. Not only will the Baby Boomers flood onto the retirement rolls in the years ahead, but they will do so almost completely dependent upon the generous Welfare State income and medical entitlements that were enacted decades ago.
That is to say, most of the households in the impending retirement bow wave have essentially no accumulated savings and liquid financial assets.
The evidence for that proposition is in the Fed’s own wealth data. In essence, the bottom 50% of households have no material assets outside of their own residences, which they will either need to continuing living in during retirement or sell into a market that is bereft of buyers owing to the $1.4 trillion student debt burden being carried by the next generation.
In fact, 30 years of Fed money-pumping has been absolutely perverse relative to the Welfare State cost eruption now at hand.
Thus, total assets held by the top 1% (red line) have soared by 7X from $5.0 trillion in Q3 1989 to $35.2 trillion in Q3 2019. That $30 trillion gain mainly reflects financial assets that have been inflated to a farethewell by Fed policies.
By contrast, the bottom 50% of households—-some 65 million units—have gained just $5.6 trillion, according to the Fed’s own data. Yet when you take the housing gains and inflation out of the current $7.3 trillion of total assets held by the bottom 50% of households, there is really nothing left for retirement—-or even the rainy days which may come before.

When you look at the net worth data (i.e. assets less debts), the skew is even worse. For one thing, the share held by the bottom half of households was only 4.0% back in 1989 and has subsequently shrunk to just 1.6% of current total household net worth of about $107 trillion.
More importantly, the $7.3 trillion of assets held by the bottom 50% of households is heavily offset by home mortgages and auto, credit card and other debts.
Consequently, net worth of the bottom 50% of households in Q3 2019 amounted to just $1.7 trillion, and almost all of that was attributable to equity in personal residences. When it comes to liquid net worth that could be drawn down during retirement, therefore, the bottom half of US households have almost exactly none.
By contrast, the net worth of the top 1% (brown line) has soared from 22% to 33% of the total. In dollar terms that amounts to $34.5 trillion, presumably enough to handsomely support the retirement years of the 1.3 million households comprising the top 1%.
Then again, there’s something else. The top 1% of households (1.3 million) now have 20X more net worth than the bottom 50% (64.3 million). So when it comes to the massive welfare state deficits coming down the pike, the odds that the political system will attempt to close the fiscal gap via entitlement reforms and benefit cuts as opposed to soaking-the-rich taxation are somewhere between slim and none.
In essence, what lies hidden in the Baby Boom retirement bow wave is the politics of Elizabeth Warren and her imitators, heirs and assigns. Whatever they succeed in enacting, of course, will mean even less GDP growth than the anemic potential already in the pipeline, as we will address in Part 2.

In short, massive entitlement cuts to upwards of 80 million retired beneficiaries will now be absolutely impossible to achieve legislatively and would provoke out right mass rebellion if they were enacted; and massive tax increases—including the aforementioned Warren-style wealth taxes— to absorb these soaring entitlement costs would bring an already struggling economy to its knees.
But rather than take preventative budgetary action while there was still time, Washington spent these pivotal years ignoring Welfare State entitlements, ramping-up the Warfare State budget and cutting taxes whenever it could.
And then came along Donald Trump who doubled down on this embedded fiscal default, demanding more Warfare State, no tampering with the Welfare State and lower taxes, too.
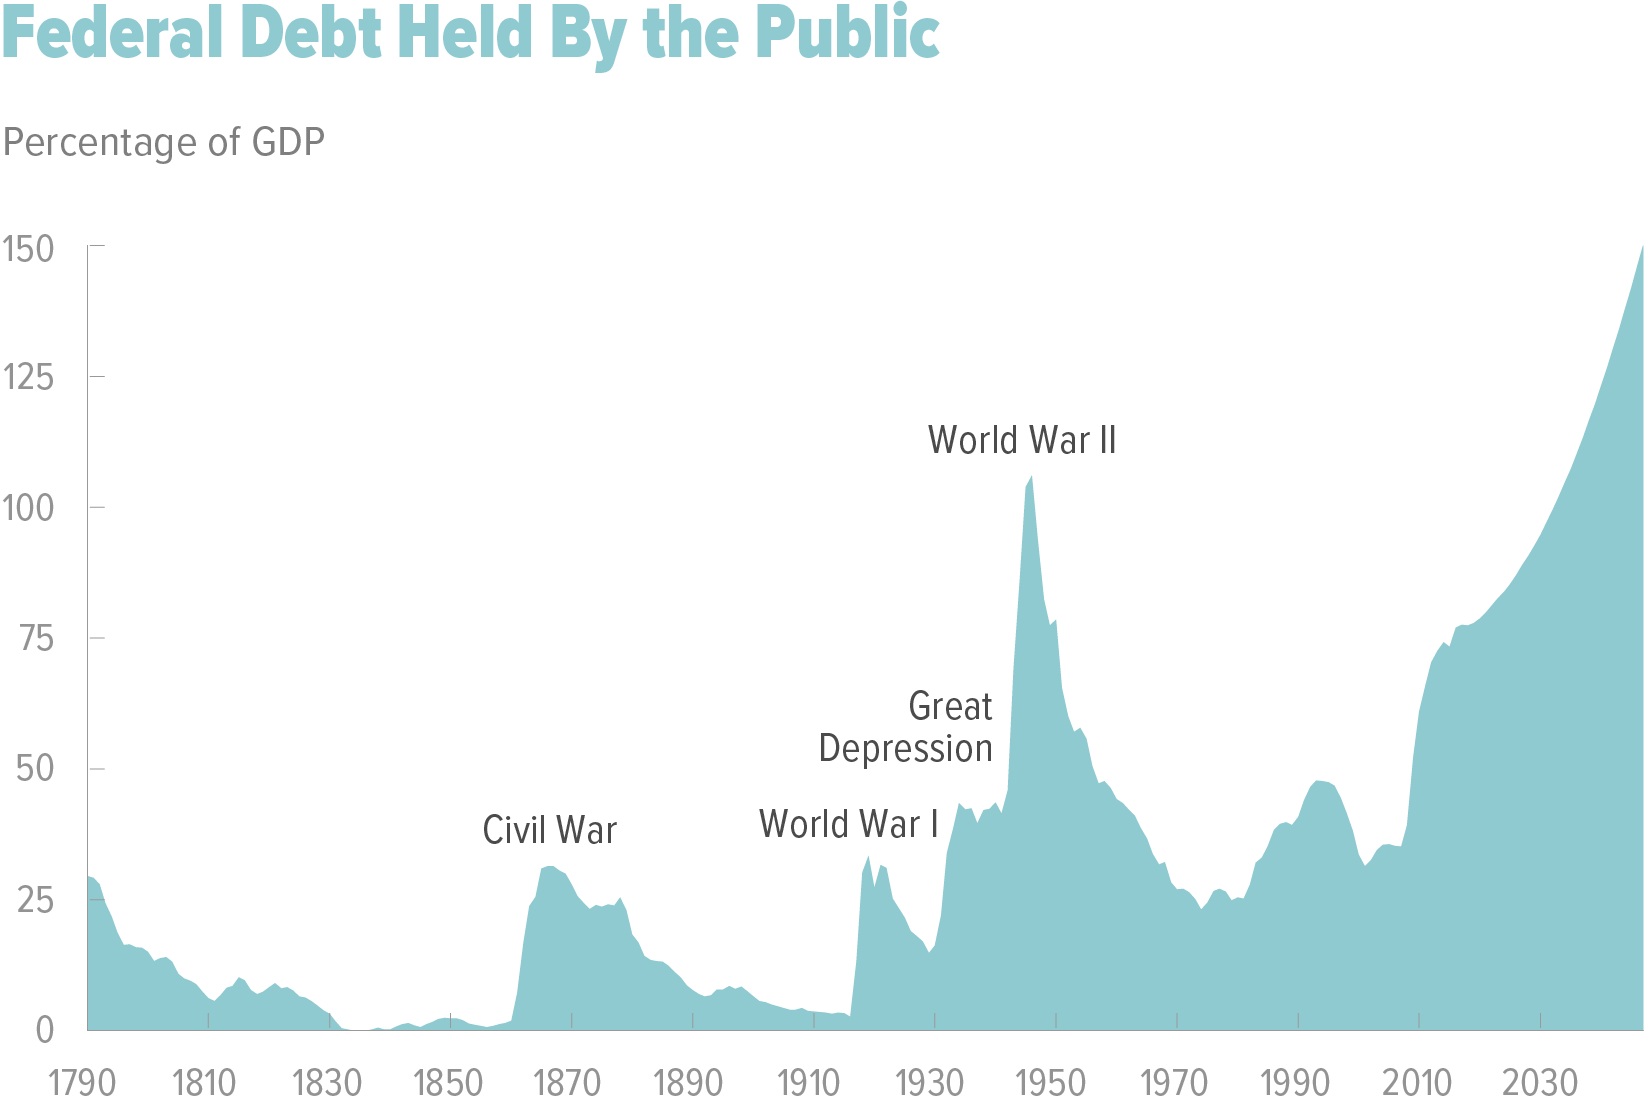
Accordingly, the public debt has already doubled from $5 trillion in 2000 to $23 trillion at present and will reach $43 trillion by the end of the 2020s based on current policies. Yet the retirement spending bow wave is just beginning its long-term ascent.
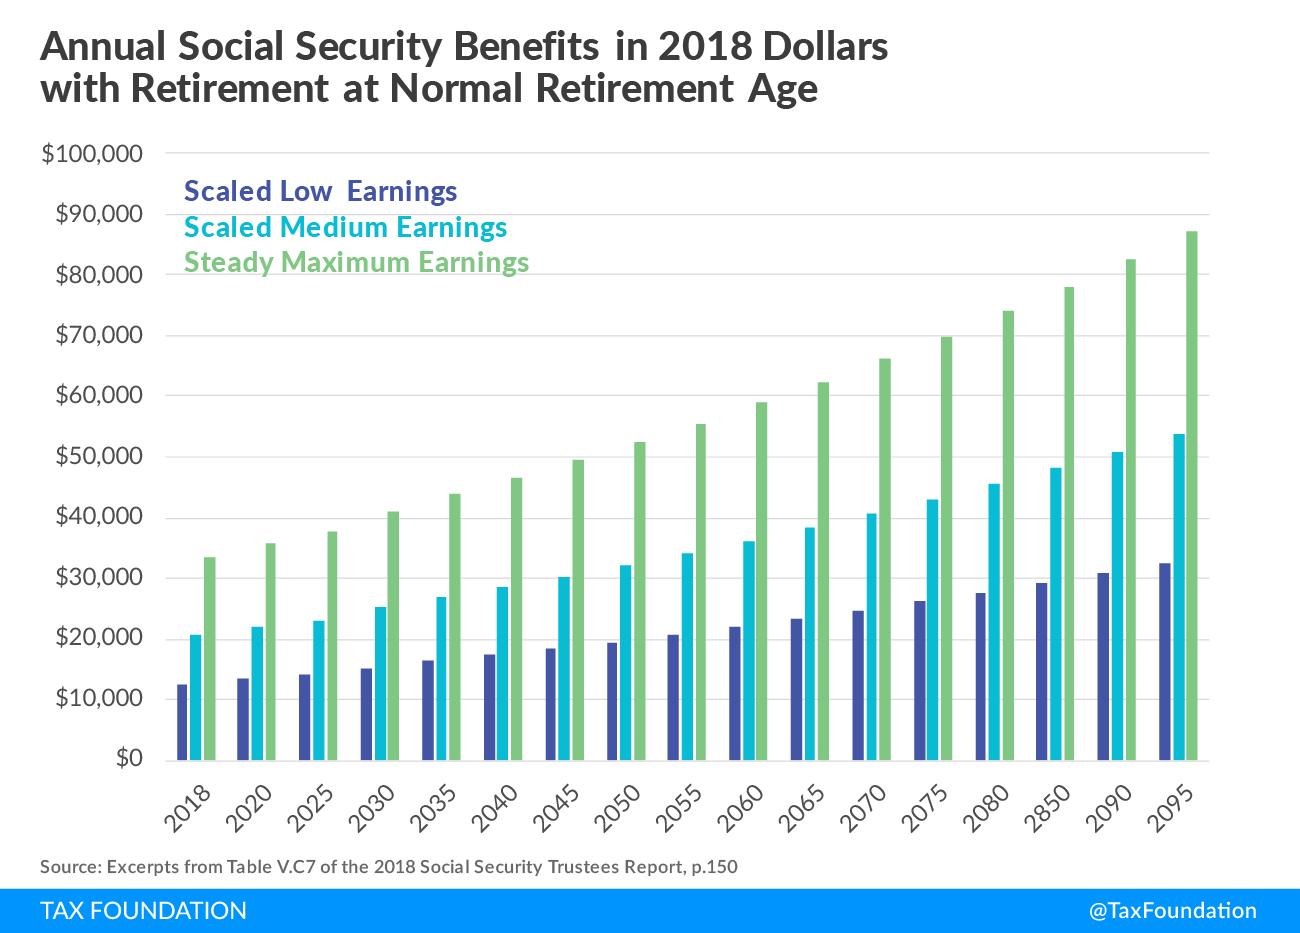
The above referenced demographics are forbidding enough, but that was not the only big fiscal thing swept under the rug during the Lost Decades. Owing to the social security benefit formula, average benefits per recipient in real terms (2018 dollars) will double over the next several decades and ultimately triple in the longer run.
For instance, constant dollar benefits (2018 $) for medium earners (light blue bars) will rise from $20,000 per year today to nearly $30,000 by 2040 and then $50,000 in the longer run. Likewise, constant dollar annual benefits for top earners (green bars) are projected to rise from $33,000 at present to $88,000 eventually
In short, there is a doubly whammy built into the social security entitlement system: Both the retired population and benefits per retiree are slated to soar during the decades ahead.
As we will also show in Part 2, the Baby Boom retirement wave is now plowing right into a Welfare State benefit structure that was designed for your grandfather’s economy based on 3-4% annual GDP growth and a stable full-time labor market.
As we will document, however, that is not remotely close to the debt-burdened, low-growth, low-productivity economy and gig-driven labor market that actually exists in the US economy today and is likely to prevail for the indefinite future.
After all, the Trumpite/GOP policy of Trade Wars and Border Wars and essentially wanton fiscal debauchery can hardly be expected to make it any better.
So the ultimate fiscal calamity from this collision is barely reflected in the official long-term projections which show the public debt heading toward $35 trillion by the end of the 2020s. Yet even those projections assume that there will be no recession for 240 months between 2009 and 2030, and that trend GDP growth will revert to historic productivity performance metrics.
To the contrary, the economic performance outlook for the next decade is considerably more dire—meaning that the public debt will double to $43 trillion and 150% of GDP by the end of the 2020s and only get steadily worse thereafter.
In its latest projections, for example, the CBO shows the medical and social security entitlements alone will nearly double from 10% to 18.6% of GDP in the decades ahead.
To be sure, it might be argued that the prospective public debt explosion could have been cured with some combination of sweeping entitlement reforms and major tax increases designed to close this yawning fiscal gap. But there is one over-powering reality that says essentially: No mas!
To wit, since the turn of the century there has not been a single meaningful entitlement reform or permanent tax increase enacted on Capitol Hill. And now that the window is closing on the Lost Decades, the prospects are only diminishing and rapidly so.
In part, that’s because the Trumpified GOP has given up on fiscal rectitude entirely, and has actually taken Social Security and Medicare off the budget table.
Yet that posture is not about to change in the foreseeable future owing to the raw political facts of life. To wit, in the decade ahead there will be upwards of 100 million voters in retirement status or within shouting distance of retirement age—-meaning that the political force against benefits cuts will be insuperable.
At the same time, the work force relative to the retired population is rapidly shrinking, as shown in the graph below. Within a decade, the level of tax rate increases needed to meaningfully close the gap would be flat-out prohibitive from both a political and economic incentive point of view.
So what is coming down the pike is a fiscal calamity. The Baby Boom/Welfare State tidal wave plus the exploding net interest expense of what will be a $43 trillion public debt will inexorably drive Federal outlays toward 30% of GDP.
By contrast, the current policy revenue baseline—including the overwhelming GOP insistence that the Trump Tax cuts be made permanent—- would not even reach 17% of GDP.
At bottom, therefore, double digit annual deficits are baked into the fiscal cake as far as they eye can see.
It does not take a lot of “big data” calculations to see what happens in a low growth economy saddled with permanent double-digit fiscal deficits. Namely, the cumulative debt build-up goes parabolic and insolvency is only a matter of time.