We have been treating with Washington’s endless capacity for fiscal profligacy for nearly five decades now. So there’s not much in the insanity category that can surprise us anymore.
Except, we just looked at the FY 2019 numbers thru February and have to marvel. During the month of February alone the Federal government spent $398 billion and collected just $171 billion—-meaning that it borrowed 57 cents of every dollar outlayed.
You can’t make this stuff up—even after you account for timing anomalies in the February numbers and the fact that it’s not a big month for revenue collections.
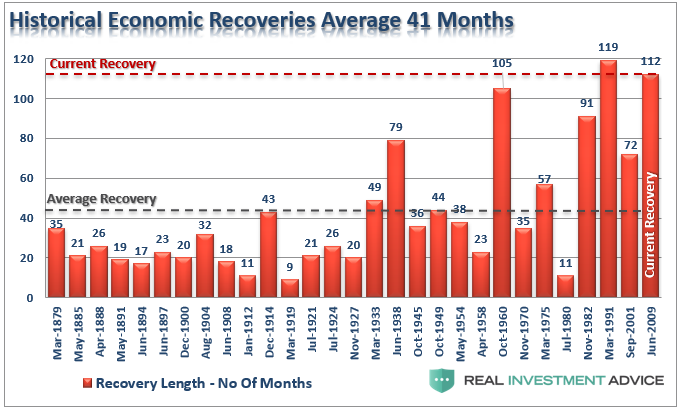
Still, February was month #116 of the current business expansion and stands just three months from the all-time record of 119 months posted during the far more benign environment of the 1990s technology boom. Accordingly, we are at the tippy top of the business cycle, and to our knowledge there has never been a textbook written—even by the most rabid Keynesian scribbler—that recommended borrowing such an ungodly share of outlays at this stage of the game.
And we are talking ungodly here—even when you look at the full fiscal year to date, thereby removing the short-term anomalies in the February figures. To wit, during the October-February period, Uncle Sam spent $1.819 billion and collected just $1.282 billion, generating red ink of $537 billion.
That red ink amounts to 30% of outlays and there is nothing distorted about it. In fact, it exactly embodies the lunatic fiscal policy adopted by the Trumpite/GOP during the 22 months of Deep State distraction known as RussiaGate.
Call it the Four Horseman of fiscal demise. That is, a ballooning Welfare State, a booming Warfare State, soaring interest expense and a rock-bottom revenue take from a flat-lining economy.
These four factors are the powerful vectors which are ransacking the nation’s fiscal equation on a long-term basis, but they were no less evident during the first five months of FY 2019.
In round terms, spending grew by 6% and revenue grew by 0% compared to FY 2018; and last year wasn’t any aberrationally low starting point, either, given that it had generated a $779 billion deficit equal to 3.8% of GDP.
Moreover, it is the details which underscore the true disaster. To wit, Social Security/Medicare outlays were up by 5.0%, defense by 9.5%, veterans outlays by 10.0% and interest on the public debt by 15.0%.
On the other hand, individual income tax collections were down by $20 billion or 3% from last year and corporate receipts dropped by $14 billion or a whopping 19.2%. These plunges happened notwithstanding a 4.5% increase in wage and salary incomes and flat pre-tax corporate profits during this year’s first five months compared to last year.
Needless to say, spending is more out of control than ever and the ballyhooed tax cuts are not paying for themselves—not even remotely so.
That much is even evident from the Rosy Scenario budget projections made by the White House two weeks ago. It assumed a 5.2% gain in nominal GDP during FY 2019, which we think is not remotely likely for reasons spelled out below, but even then it projected full year revenue gains of just 3.2% versus a spending increase of 10.2%.
The math doesn’t lie. OMB is projecting a $1.1 trillion or 5.1% of GDP deficit for FY 2019. That is, it is forecasting an off-the-charts borrowing requirement during a fiscal year which will end in month #123 of the current business expansion—-a point that has never been previously attained in all of recorded US history (see chart below).
In fact, when the economy peaked at the end of the tech boom in the year 2000, the Federal budget was in surplus at 2.3% of GDP. In large part that’s because defense spending was still at pre-war on terror lows, Welfare State outlays were just beginning their demographically driven ramp and revenues were swollen by capital gains collections.
Indeed, compared to the last time the US economy was at the tippy-top of a 119 month business expansion, the Trump/GOP budget is upside down. Back then, spending came in at just 17.5% of GDP compared to 21.3% projected by OMB for the current fiscal year; and revenues posted at 19.7% of GDP compared to 16.1% projected for FY 2019.
Needless to say, embracing a 21% of GDP spending program while boasting about a 16% of GDP revenue policy based on credit card financed tax cuts is utterly irresponsible at any point in the cycle. But to do so when the economy is at the octogenarian stage of the business cycle is tantamount to madness.
At today’s sized economy, the year 2000 surplus shown below would have amounted to $500 billion—meaning that the actual (and optimistic) number projected by OMB for FY 2019 amounts to a $1.6 trillion swing for the worse.
Of course, when you start this deep in the red and then recession hits tax receipts and unemployment/safety net outlays, it’s simply Katy-bar-the-door.

These comparisons also make clear why the assurances of the Donald’s economic cheerleader team of Kudlow & Hassett that we can grow our way out of the fiscal danger zone are so absurd.
The fact is, outside of the 2009 recession, the current revenue take of just 16.1% of GDP is the lowest in modern history. It’s actually below the 16.5 % of GDP collected during CY 1983-84 before even the Gipper concluded that his original tax cut had gone too far, which then caused him to sign three tax increase bills which raised the revenue take to 17-18% of GDP during the balance of his time in office.
But here’s the thing. Reagan was at least willing to give lip service to shrinking the Welfare State, even as he poured budget dollars into the Swamp on the Pentagon side of the Potomac.
By contrast, the Trumpite/GOP proposes to have a tax burden lower than the Gipper’s lowest year—-even as it seeks $4.8 trillion of spending for FY 2020, which represents an $820 billion gain from the $3.98 trillion level it inherited from the Obama Administration in FY2017.
That’s a 21% increase in just three years; and it makes a mockery of every single GOP speech about fiscal rectitude and the dangers posed by the socialistic Dems.
Indeed, with policies like these you don’t even need the socialist young turks on the Dem side of the aisle to pave the way to national insolvency; the Trumpite/GOP already has the nation well on the way.

The skunk in the woodpile, of course, is that the Gipper’s low-tide revenue years and big budget deficits occurred in the first years of a business cycle expansion, not the last; and they happened when the baby-boom was just flooding into the work force, not clambering to get on the Welfare States retirement welcome wagon.
As we will demonstrate in Part 2, therefore, the difference between the macroeconomic and demographic conditions of the 1980s versus the 2020s are as between day and night.
Not the least of these is the stage of the business cycle. As is evident in the chart below, the so-called Reagan Boom lasted 79 months, but the big deficits (relative to GDP at 5-6%) occurred in the first 24 months of the recovery.
By contrast, the Donald didn’t take office until month #90 of the current cycle, and has spent the last two years digging prodigiously into an ever deeper fiscal hole. Accordingly, the odds that anything remotely similar to the Rosy Scenario on steroids forecast which is embedded in the Trump 2020 budget will actually materialize is somewhere between slim and none.
That is to say, the new Trump budget assumes the US economy goes 243 months without a recession!
Yet here is all of recorded history from 1879 forward and we needn’t have to ask. Is there anything which looks like a 20 year+ business expansion in this chart?
Here is the fundamental point that the faux supply-siders of the Larry Kudlow/Kevin Hassett/Stephen Moore school never come to terms with. To wit, what counts for the long-term fiscal outlook is not the real GDP growth rate for any given period of time, but the amount of nominal GDP under the curve.
That’s because in an indexed tax system revenue only grows at the rate of nominal GDP (i.e. there is no bracket creep); and in a giant retirement-driven Welfare State, the “real” versus inflation share of nominal GDP doesn’t much matter because entitlements are demographically rather than jobs driven.
As we will demonstrate in part 2, therefore, the Trump budget for FY 2020 is a colossal joke. It assumes 10 years of 5.1% nominal GDP growth—meaning that it is based on $282.3 trillion of GDP under the curve.
Yet if you assume the inevitable–at least one recession before 2029—-and an average rate of nominal GDP growth equal to the actual rate for 2007-2017, the amount of nominal GDP under the curve is only $249.8 trillion.
Needless to say, a $32.4 trillion shortfall of GDP is a meaningful number, even for government work!
It implies $6.5 trillion of lower revenue over the 10 year period and more than $40 trillion of public debt by 2029 when the other dubious assumptions embedded in the Trump budget are accounted for.
Still, that’s not the half of it. As we will also show in Part 2, the US economy can stand a lot of punishment from Washington, but $40 trillion of public debt in the face of the Baby Boom retirement tsunami is not among them.