The White House is leaving nothing to chance. At least, that’s why they apparently leaked March’s CPI number ahead of its scheduled Tuesday morning release:
White House braces for ‘extraordinarily elevated’ inflation numbers
In fact, however, double-digit inflation is actually already here. As Doug Rudisch noted,
Well I finally found (below) what I was looking for as a more objective measure of actual inflation.
Something that aggregates actual prices, as opposed to substituted, hedonicized, surveyed, estimated, and statistically tortured prices that the CPI produces. This probably still understates actual inflation because it is also consistent with the CPI basket which does not reflect consumption patterns for a majority of Americans (seniors and anyone not filthy rich), which is more weighted to food, energy, and healthcare.
Not hard to do, since the prices of everything can be found online.
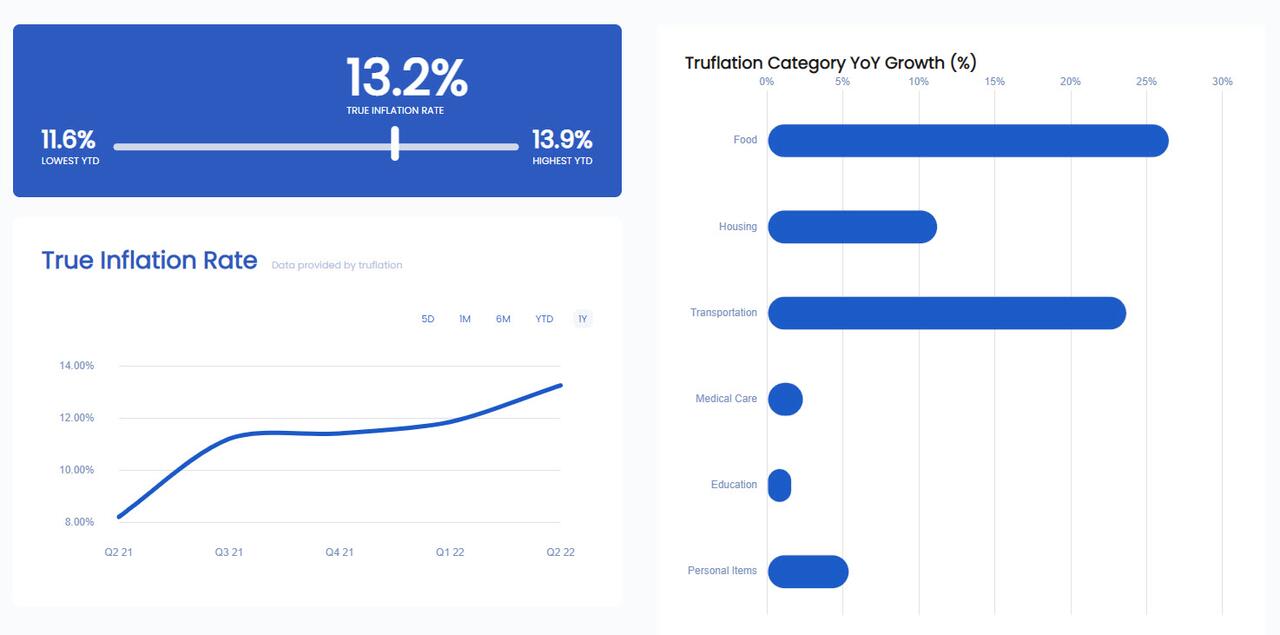
And what do you know, actual prices suggest 13.2% inflation with the cost of food up 26.5% (which again is a higher portion of the basket for ~50%+ of the population than the CPI basket). Same for energy. This compares to the 7.9% in the CPI.
Interestingly the 13.2% also happens to be close to the 16% Shadow Stats is showing using the 1980s CPI methodology, and the 12% using the 1990s CPI methodology (http://www.shadowstats.com/alternate_data/inflation-charts), so maybe they are not a bunch of kooks over there after all and maybe the way it was done in 1980 and 1990 before it became massively gimmicked, was closer to the truth, which is what real online prices reflect?
The reference here is to a new on-line inflation measure called “Truflation”. For our money, that moniker is a hell of a lot more sensible than the central bankers’ like sounding humbug called “Lowflation”.
Here’s the core difference between the CPI and the Truflation index. The BLS index is based on survey data, which is then adjusted, imputed, massaged, manipulated and tortured nearly beyond recognition. By contrast, the Truflation index reflects actual transaction price data straight from real world “cash registers” as it were. That is, daily inflation changes based on pure market price data from sources like Zillow, Penn State and Nielsen, among others.
Meanwhile, Wall Street dreams on. Here’s a recent encomium to the Fed’s wisdom and prescience by one of Bubble Vision’s megaphones, who reliably transmits the current chatter from the casino:
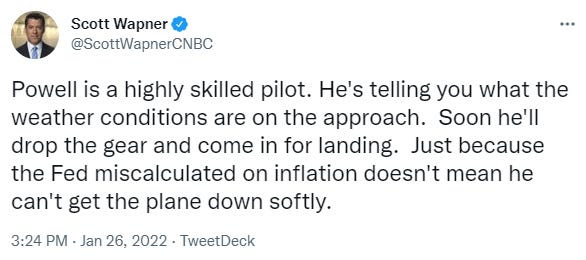
Looking at the chart below on the Fed’s recent inflation forecasts, of course, does not bring to mind the notion of “highly skilled”. As recently as a year ago, the consensus of Fed head’s pinned current inflation at, well, 2.2%!

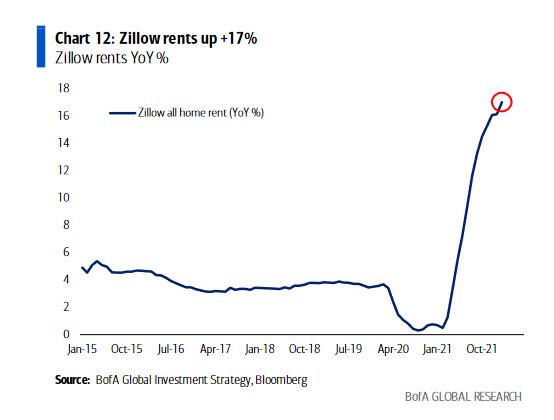
Actually, one reason the Eccles Building has been so far behind the eight-ball on the inflation tide is that the BLS’ measure of rental inflation—-the largest single component of the index by a long shot—inherently lags behind real world outcomes. That’s because the renters and landlords in its survey’s are contacted only once every six months, leaving the green eye-shades at the BLS to extrapolate the months in between.
Of course, when the rate of recent inflation is accelerating sharply, as it is presently, the BLS extrapolations are a day late and dollar short. That’s why Trueflation’s reliance on Zillow’s market-based rental rates is so much more accurate, and is currently up 17% on a Y/Y basis.
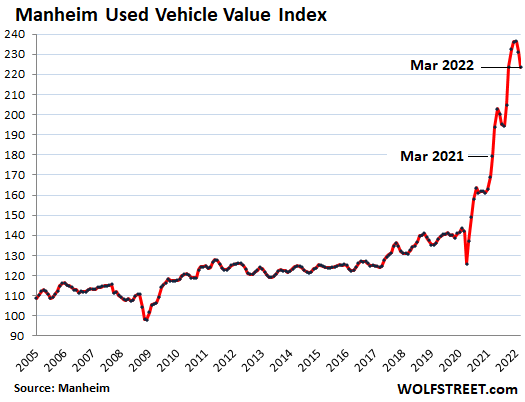
One of the CPI components most closely aligned to the real world marketplace is the used car index, but even there a considerable lag is evident. Thus, the CPI for used cars is up by 56.9% since June 2020, whereas the real world used car auction pricing as reflected in the Mannheim index is up by 75% during the same period.
CPI Used Auto Index, June 2020 to February 2022
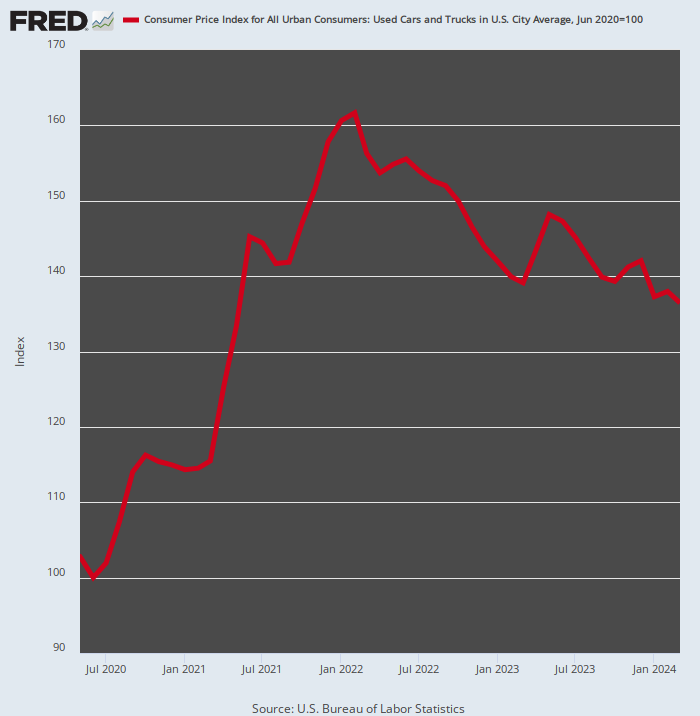
Moreover, at each of the notch points since used car pricing took off in mid-2020, the Fed and its Wall Street megaphones have been quick to say that the index has peaked and that it’s outsized contribution to the overall CPI rise will now be reversing. In other words, owing to a few reversible outliers like used car prices the overall inflation rate was held to be elevated on only a “transitory” basis.
One of these days used car price may indeed roll-over and not for just a monthly blip as displayed above. But new auto sales have been so weak in recent months that the eventual relief from a flood of trade-ins and off-lease vehicles is surely a long way off.
In fact, the March new light vehicle SAAR (seasonally adjusted annual rate) was just 13.33 million units—a figure nearly 25% below the 2015-2018 average.
Light Vehicle Sales At SAAR, 2015-2022

The larger point is that even if new and used auto prices come off the boil later this year, they are not heading back to where they stood prior to the Covid and now war driven disruption of global supply chains and trade. As Wolf Richter recently noted, there has been a step-change increase in auto pricing and recent easing will not do much to relieve hard-pressed household budgets:
The entire industry has been shaking its head about them: That retail customers paid those prices though there was plenty of supply; that dealers then bid up prices at wholesale auctions to ridiculous levels, knowing that they could pass on those prices to retail customers and make massive per-vehicle gross profits; and that lenders accepted the ridiculous collateral values and lent. And everyone, astonished as they were about this bizarre phenomenon, played along for as long as possible.
But in March, wholesale prices of used vehicles that were sold at auction fell 3.3% from February on a mix-, mileage-, and seasonally adjusted basis, according to the Manheim Used Vehicle Value Index. Manheim, a unit of Cox Automotive, operates wholesale auto auctions around the country and online, that handle around 8 million vehicles a year.
Compared to March last year, which was already in the middle of the spectacular price spike, prices were up by 24.8%, a huge ridiculous jump, but it was the smallest year-over-year jump since August 2021.
That’s right. When the year-over-year increase “eases” to just 24.8% the Fed heads are indeed way behind the curve. And one reason for that is the ludicrous group think that prevails in the Eccles Building with respect to the “inflation expectations” theory.
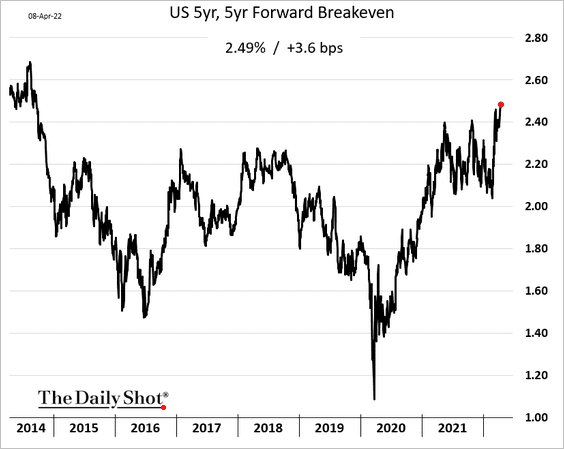
Based on empirical evidence and financial logic the whole notion amounts to academic tommyrot. For instance, the preferred measure of inflation expectations is the so-called 5-year, 5-year forward breakeven.
This metric is calculated as the difference between the regular 5 year treasury rate and the 5 year treasury inflation-indexed (TIPS) security rate. This spread, in turn, is supposed to represent the bond market’s sagacious estimate of the expected inflation in the next 5 years, on average.
But here’s the thing. The bond market is not a forum for honest price discovery. To the contrary, it’s the whorish venue where the Fed’s flood of liquidity systematically falsifies bond prices and invites speculators to front-run the Fed’s massive intervention on the demand side of the market via its multi-trillion QE purchases.
Accordingly, at any point in time, the so called inflation break-even is nothing more than the momentary spread between the prices of two US Treasury securities which are driven by massive short-term speculation. In fact, so short-term that most of these speculators’ position are carried by overnight repo, meaning that position size and therefore prices in the bond pits can change on a dime based on new signals from the Fed or unexpected shocks from the real economy.
Not surprisingly, therefore, the inflation breakeven at any moment in time is not worth the paper it is printed on. For instance, during much of 2017, the 5yr, 5yr Forward Breakeven signaled an average inflation rate of 1.90% for the 2018-2022 period ahead.
As it happened, the average inflation rate for that period will come in at double this figure, or 3.65% per annum, and that will be true only if the CPI for 2022 manages to not rise above 8%— versus the 10% or better rate, which is probable.
Yet, the Fed was supposedly steering policy back then based on a metric which is essentially bond-traders’ noise. Worse still, that noise in the bond pits is now forecasting average inflation of just 2.49% per annum for the next five years.
Good luck with that, we’d say.
In short, the Fed has massively inflated the asset markets, and now the goods and services sectors too, based on faulty Keynesian theories of demand management and on forward guidance metrics like the Inflation Breakeven that are faulty to the core.
Not surprisingly, therefore, it has painted itself into an hellacious corner. As Eric Peters noted, the economic system through which the Fed must now try to intermediate a sharp brake on inflation while achieving a soft-landing is no longer what it used to be; it’s now run by financial gamblers, not economically-driven businessmen.
Back when the US economy had less debt and leverage, when financial assets had lower valuations, and when wealth was less concentrated, the ups and downs of the real economy drove financial markets. In such a world, the Fed quite easily used conventional rate policies to influence our behaviors to achieve their objectives.
When those became less effective, they introduced unconventional policies, and forward guided their intentions to become highly predictable. The effect was the hyper-financialization of our economy.
Now, with such high levels of debt, leverage, valuations, and wealth-concentration, it is financial markets that drive the real economy, not the other way around. We have never experienced a modern economic cycle that looks anything like this.
He got that right. Since the last cyclical bottom in early 2009, what has grown by leaps and bounds is not the main street economy, but Wall Street based asset prices. And the implications are clear as a bell.
As former Fed Vice-Chair, Bill Dudley opined out loud last week, the only way for the Fed to bring inflation to heel is to crash the stock market—an eventuality that is surely NOT “priced-in”.
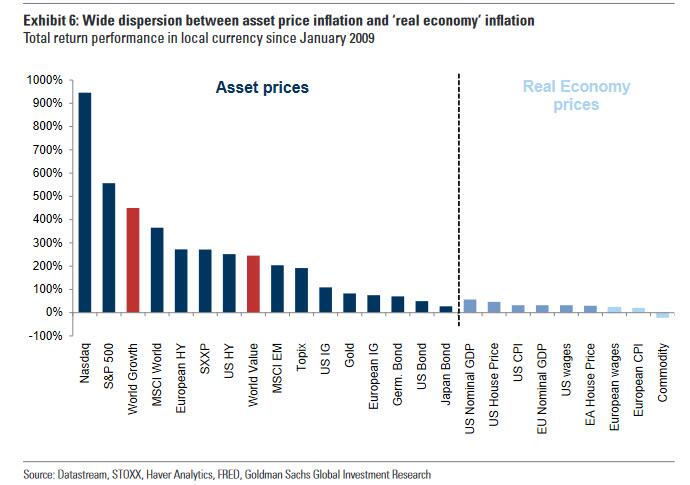
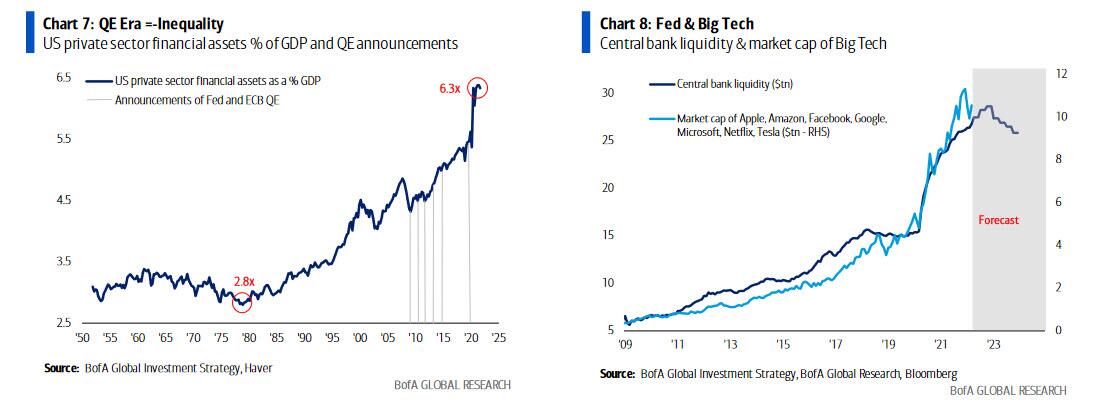
For want of doubt, here is a sample of the endless proof available for the taking. Financial asset values relative to the income-producing capacity of the US economy (i.e. GDP) is off the charts at 6.3X.
In turn, that massive infusion of fiat credit never left the canyons of Wall Street, thereby driving the Big Tech growth stocks in lockstep with the massive flood of fiat credits generated by the Fed and its fellow-traveling central banks around the planet.
One of the reason that all this money pumping hit financial asset prices rather than goods and services first is that $7.6 trillion of stock buybacks since 1999 far outweigh the $4.6 trillion of annual wage and salary increases during the same period.
the
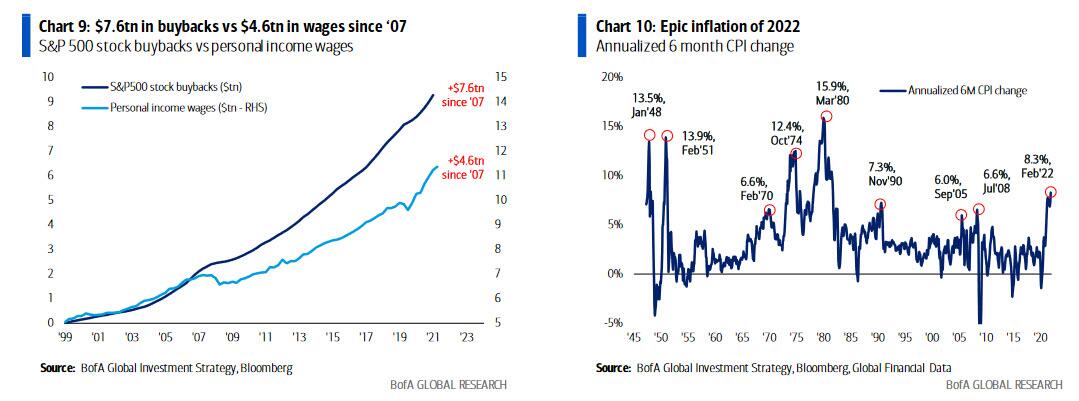
In any event, as one analyst postulated, the sun, moon and stars are now lined-up for Fed-induced financial crack-up which will be one for the ages:
- QE + asset prices + fiscal stimulus + COVID + war…epic inflation of 2022…US CPI 8% (highest since 1981), German CPI 7% (highest since 1952), European PPI 31%, food 21% YoY, heating 50%, Zillow rents 17%, house prices 19%. Amazing.
Lest the impending reversal of the printing presses be taken too lightly, it is well to recall that the QT (quantitative tightening) era at $95 billion of Fed bond sales per month starts in 19 days. Once that commences, the Fed’s current balance sheet of $9 trillion is set to decline to $6.5 trillion by the end of 2023; and contrary to Wall Street expectations, the probability that the Fed will capitulate early like it did in 2019 is somewhere between slim and none.
That because back then its faulty inflation measuring stick was running at 1.7% on a Y/Y basis, but this time it will be in the 7-10% range until the Fed’s belated inflation offensive finally causes the US economy to buckle-over into recession.
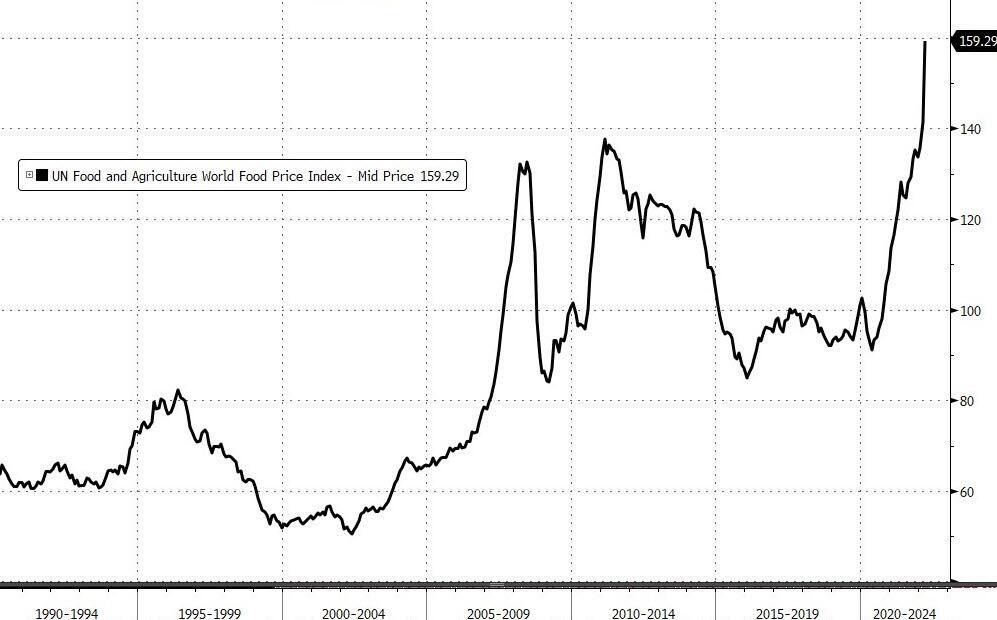
Moreover, given that the heart of the current roaring inflation is in energy, food and other everyday commodities, the notion that the Fed will be in a position to back-off from its inflation battle when the market goes tilt fails to appreciate the political back-drop. To wit, during the next several quarters food prices will be soaring like at no time since the 1970s, even as the GOP pounds home the inflation story day after day to an outraged American public.
Accordingly, there will be no place for the Fed to hide or excuse to restart the printing presses.
UN Food Price Index
In the meanwhile, the fiscal bacchanalia continues. In a desperate bid to save their mid-terms bacon, the House Dems are ginning up another Covid-relief boondoggle that is not only too stupid for words, but actually so stupid that a decent phalanx of Republican’s are likely to support it in the House and Senate, thereby raising the odds considerably that it will get to Sleepy Joe’s desk.
The legislation were are referring to would add another $42 billion to the Restaurant Revitalization Fund, on top of the $28.6 billion that was previously approved in the American Rescue Plan that Democrats passed in March 2021. The funds would be directed to the tens of thousands of food service providers that allegedly lost out on funding in the first round of this gravy train.
The House legislation would also create a new Hard Hit Industries Award Program that would give up to $1 million grants to small businesses across all industries that suffered at least 40% pandemic-related revenue loss in 2020 and 2021, when compared with 2019 revenue.
In truth, the bill is nothing more than another blue-state bailout. Liberal governors and mayors destroyed small businesses for two years with endless lockdowns, and now their friends in Congress are looking to reward their bad decisions, to the tune of $42 billion.
As one wag noted, when Congress started this program a year ago, it became a buffet line for well-off woke corporations, including affiliates of Disney. So there is no reason to believe it won’t happen again.
Back then, soon after it opened, the Restaurant Revitalization Fund ran out of money. More than 278,000 businesses submitted applications for $72.2 billion in requested funds – far exceeding the available amount of $28.6 billion in restaurant grants.
As it happened, more than 100,000 businesses received funds during the first round of the program, including caterers, bars, breweries, wedding venues, airport concessions and wineries. But about 177,000 other businesses were turned away because there was not enough money, according the SBA.
But with election season fast approaching, you can count on the bipartisan duopoly to be sure that no “deserving” restaurant will be left behind, along with a lot of fraudsters, too.
After all, the results of earlier rounds of these SBA giveaways tell you all you need to know. With respect to the overall Paycheck Protection Program and the Economic Injury Disaster Loan, an SBA inspector general report in 2020 found $78.1 billion in potentially fraudulent loans and grants to ineligible entities.
So to paraphrase Senator Everett Dirksen’s famous quip about a “billion here, a billion there” of overall government spending, we have now reached the point where it applies to fraud alone.