The Donald was out in full-throated bombast mode at the New York Economic Club today, boasting almost violently about what he calls the Greatest Economy Ever. Yet it is nothing of the kind—-and is actually a cogent reminder that prosperity is a gift of capitalism, not the handiwork of vainglorious politicians.
So we must first of all say it again: The main street economy operates on the Fed-driven business cycle, not the presidential election calendar.
By a quirk of fate, the Donald was sworn-in during month #90 of the current expansion–a longevity point attained only twice before when Richard Nixon was elected in month #94 and George Bush the Younger in month #117.
The reason this is fundamentally important is that very late in the cycle, levels of economic activity always look impressive because they are cumulative, whereas rates of change are far more problematic because octogenarian business expansions tend to peter out in their waning days.
Needless to say, early in the cycle the political hacks on the Washington-end of the Acela Corridor and the stock peddlers on the Wall Street-end gravitate to the high rates of change that come with the rebound from recession, such as is reflected in the number of jobs gained or the annualized growth rate of GDP.
By contrast, near the end of the cycle they switch to level based indicators, such as the total number of American employed, the average weekly wage or real median family income. All of these latter measures, of course, capture the accumulation of all historic gains; they stand on the shoulders of all that came before.
So, yes, with 158.5 million employed in October 2019, there were more Americans working than ever before in history.
But so what!
The same thing could be said by every president of modern times. Thus, there were 61.6 million employed when Eisenhower was sworn in during January 1953, but by the end of his years in office and those of his successors, the level was higher each and every time:
- Eisenhower, January 1961……………65.8 million;
- Kennedy-Johnson, January 1969….76.8 million;
- Nixon-Ford, January 1977…………….89.9 million;
- Carter, January 1981…………………….100.0 million;
- Reagan, January 1989…………………..116.7 million;
- Bush the Elder, January 1993………..119.3 million;
- Clinton, January 2001…………………..137.8 million;
- Bush the Younger, January 2009……142.2 million;
- Obama, January 2017……………………152.2 million;
- Trump, October 2019……………………158.5 million
Total Number Of American Employed, 1953-2019

The same thing is true of most other level type indicators, most notably that for median real family income—albeit the rate of rise has slowed sharply. As shown in the chart, between 1953 and 2000, real median family income more than doubled from $35,000 to $74,000. That amounted to a 1.61% rate per annum over that 47 year period, and posted higher during every presidential tenure.
During the last 18 years, the rate of improvement has slowed to just 0.33% per annum, but the $78,646 posted in 2018 on the Donald’s watch is still yet another all-time high.
That is, a further ratchet higher of the real income level because capitalism keeps growing no matter who is in the Oval Office and no matter what kind of obstacles and impediments Washington throws in its path.
Real Median Family Income, 1953-2018

So the issue at hand with respect to the Donald’s MAGA boasts is whether his policies have accelerated the rate of change, not the economic levels he inherited with his late cycle arrival at the Oval Office; and whether they have diminished or added to the Washington policy rot that inherently threatens each business cycle expansion as it ages.
On that score, the Donald gets a D-, and that’s being charitable. Metaphorically speaking, he is just riding the wizened mule which is the American economy until it finally drops from the accumulating infirmities of cyclical old age—even as he is injecting it with so much fiscal, monetary and Trade War rot that it is destined to dwell in recessionary purgatory for years to come.
In a word, the upcoming Trump Recession will be the longest in post-war history.
He is leaving America in the throes of a fiscal nightmare; has forced the cowards on the Federal Reserve to capitulate before they had barely begun to normalize interest rates and their balance sheet, thereby leaving the Fed bereft of dry powder; and has started a Trade War with China which will fester indefinitely and pull the lynch-pin of global growth—the Red Ponzi’s successive, massive credit impulses— out from under the global GDP.
As to the rate of change, there is no gainsaying the Donald’s whiff on every relevant measure—starting with the broadest possible measure of economic activity embodied in real final sales. As we have indicated, the measure strains out short-term inventory fluctuations, thereby capturing the concurrent pace of economic activity.
The naked eye cannot pick out any acceleration in the SAAR (seasonally adjusted annual rate) for real final sales since January 2017 because, in fact, there has been none– notwithstanding the Donald’s braggadocio.
To wit, during the 11 quarters encompassing Q2 2014 through Q4 2016, real final sales grew by 2.60% per annum, where the growth rate during the first 11 quarters on the Donald’s watch has clocked in at 2.53%.
Needless to say, we don’t think Obama had much to do with the first 11 quarters in the chart below or that the Donald had much impact on the most recent 11 quarters.
America’s 159 million workers and millions of entrepreneurs, business managers, investors and inventors just keep on keeping on. So doing, they push output and living standards steadily higher—despite the contretemps of the fools and nincompoops who inhabit both ends of Pennsylvania Avenue.
So the Donald is absolutely par for the course. He is riding a lumpy but flagging business cycle in which his highest quarterly posting of 4.66% during the Q2 2018 sugar high was slightly lower than the 4.75% SAAR posted in Q3 2014, while his low of 0.76% in Q3 2018 is slightly below the 0.83% posted in Q4 2016 during Obama’s way out the door.
That is to say, no matter how you slice it or spin it, there is no evidence of MAGA in the slightest. In fact, the real MAGA was the 20-year growth rate of 3.75% per annum between 1953 and 1973; or the 12 year growth rate of 3.04% during the Reagan-Bush years.
After all, the first of these growth rates reflect averaging-in four recessionary down-turns between 1953 and 1973, and the Reagan-Bush years reflect two recessions averaged-in.
By contrast, the Donald’s 11 quarters to date have come at the top of the cycle—the equivalent of being born with a silver spoon in your mouth, which is more than a little bit apt in the Donald’s case.
Indeed, on a cyclically-adjusted basis it would be fair to say that we now have the Very Worst Economy Ever, not the imaginary boom that the Donald’s was gushing about at the New York Economic Club.
Real Final Sales, SAAR change

Likewise, the Donald claimed credit for the American capitalism at work as reflected in the level of total employment (158.5 million), which he rounded to “nearly 160 million”. We suppose that’s close enough for government work, but also note that he didn’t cite the relevant jobs figure, which is the rate of monthly change.
Understandably so. You need a magnifying glass to tell when Obama’s last 34 reports ended and the Donald’s 34 monthly reports began. But for want of doubt, the Obama period average was 227,000 per month, whereas the Donald’s average has been 191,000—which does not scream either acceleration or even great.
For instance, during the month #90 thr0ugh the end of the 1990s tech expansion cycle in February 2001 at month #119, the average monthly job gain was 2o8,000. That’s a 9% greater rate of monthly gain than during the Donald’s equivalent end-of-cycle tenure, and at a time when the total NFP was 15% smaller.
Nonfarm payrolls, change from prior month

Moreover, the raw NFP job total is inherently misleading because it counts 10-hour per week jobs at McDonald’s the same as 50 hours per week in a hot steel mill. But when it comes to the more apples-to-apples measure embodied in the weekly index of aggregate hours in the private nonfarm economy, the lack of acceleration on the Donald’s watch is even more evident.
During Barry last 34 reports, aggregate weekly hours rose by 2.25% per annum—a figure which is sharply higher than the 1.73% rate during the Donald’s 34 monthly reports. Indeed, the Donald’s figure represents downright deceleration.
Next we have real business Capex. That not only matters because long-term growth depends upon it, but also because the Donald’s signature policy “achievement” is the drastic reduction in business taxes owing to the lower corporate rate, the 20% pass-thru deduction and accelerated depreciation.
Alas, there is no sign of acceleration here, either. After the sugar high of the 2018 first half, the SAAR has actually plunged back into negative territory, dropping at a -1.0% rate in Q2 2018 and a -3.0% rate in Q3.
Real business CapEx, SAAR change

Back in the day, Republican supply-siders focussed on investment, productivity, labor inputs to production and incentives for risk-taking and innovation. We didn’t put a lot of stock in they Keynesian idol of PCE (personal consumption expenditures) because we rightly understood that over any reasonable period of time, Say’s Law prevails.
The latter embodies the economic truism that the supply-side drives growth and prosperity, and that production and income come first and spending and consumption follow.
Like in so many other areas, the Donald has stood sound economics on its head on this crucial matter, too. He’s all about goosing public and private spending, as reflected in his out-of-control fiscal policies and relentless attacks on the Fed to gut interest rates in order to goose spending.
When it comes to even the Keynesian PCE canard, however, the Donald gets no cigar, either. During his first 33 monthly reports, real PCE has risen at a 2.74% annual rate—a figure well below the 3.41% CAGR during the last 33 months of Obama’s tenure.
Again, we don’t think either of these Oval Office occupants had much to do with the outcome, but the empirical point cannot be gainsaid: Even consumption growth have decelerated, not accelerated, on the Donald’s watch to date, and that’s in a context in which the fat part of the business cycle which he is riding is rapidly aging out.
Year-over-year % change, real PCE

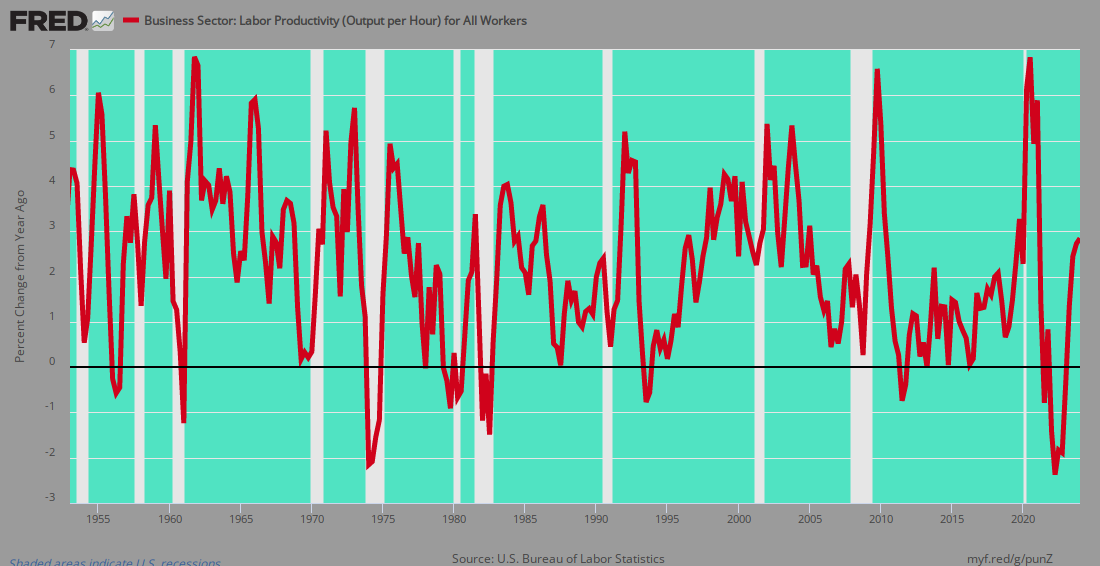
At the end of the day, of course, the ultimate metric on the main street economy’s health and sustainability is embodied in productivity. That’s the fount from which true growth, improving living standards and increased societal wealth ultimately arises.
Alas, there ain’t no MAGA in he Donald’s productivity score. In fact, it’s about the lowest in the last 70 years, and that’s a generous characterization giving that Trump’s tenure so far has been coterminous with the longest business cycle in American history.
To wit, during Trump’s first 11 quarter in office, real output per hour in the business sector has increased at 1.36% per annum. That compares to–
- 1953-1973……3.04%;
- 1980-2000…..2.09%;
- 2000-2016…. 1.88%;
- 2016-2019…. 1.36%
In a word, there’s not remotely a sign of MAGA in the chart below. Not nowhere. Not nohow.
The irony of Donald’s groundless boasting is that he is mindlessly setting himself up to become the Wile E Coyote President. That is, he’s already damn close to the cliff of recession and soon will be peddling furiously out in mid-air.

In this context, the high frequency data is increasingly dispositive. For instance, wholesale sales have now turned down decisively—even as the inventory sales ratio has reached dangerously high levels.