The reigning “narrative” on Wall Street is truly blind, deaf and dumb. That was made clear on bubble vision this AM by a spokesman for Pimco. She advised her credulous host not to worry about Sleepy Joe’s sweeping tax increases because, well, they will be accompanied by an equal amount of spending stimulus!
Let’s see. Total government spending already hit nearly 44% of GDP during 2020, but, apparently, by the lights of Wall Street’s incorrigible bulls, the wasting of another few percentage points of national income on government boondoggles and funding it with punitive taxes on America’s most productive citizens is copacetic. That’s because any and all spending—-including on pyramids, Amtrak and highways to nowhere—is purportedly additive to GDP.
That dog-earned proposition, of course, is standard fare from Wall Street’s thoroughly Keynesian economists and strategists. But it is so inherently incomplete, wrong and ahistorical that it tells you something crucially important.
Namely, that today’s egregiously inflated stock market has so thoroughly corrupted the financial narrative that traders and speculators will embrace virtually any Washington policy machination that promises a short-run, albeit artificial and unsustainable boost, to the GDP. In turn, that’s supposed to mean more corporate profits and no collateral costs.
Then again, the presumed lack of any collateral damage from all this tax, borrow and spend is not based on the evidence; it’s a given if you embrace the folly of single-entry booking.
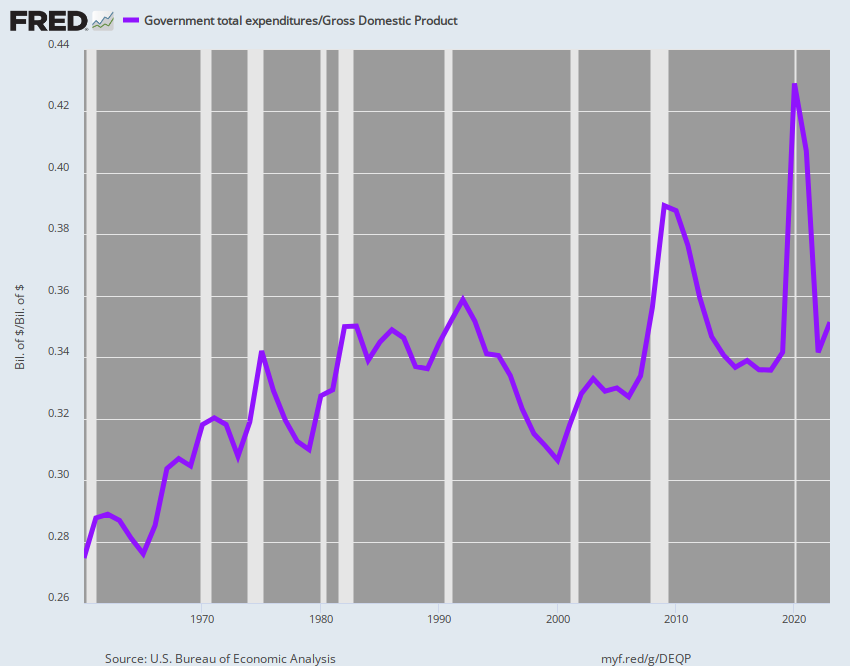
By contrast, the actual facts are rather dispositive. To wit, the 60-year trend line of real GDP growth, if shown in the chart below, would go in the opposite direction of the purple line for the government spending share of GDP.
Instead of rising from the lower left to the upper right in step with ever more government goodness, it actually declined from 3.5%+ per annum during the first several decades to less than 1.7% per annum since Washington went into heavy-duty 24/7 stimulus after the turn of the century.
Total Government Spending As % Of GDP, 1960-2020
Stated differently, after decades of the Fed’s endless “stimulus” and stock price-keeping operations, Wall Street is so bulled-up that it will believe practically anything that defies the historical truths of sound money and fiscal rectitude.
For instance, it is damn obvious that domestic wage and consumer inflation is finally rearing its ugly head after decades in which it was effectively exported to the rest of the world by the Fed’s unrelenting tsunami of dollar liabilities. But the numbskulls who occupy the Eccles Building insist that the current inflation outbreak is completely transitory—so don’t sweat the small stuff and get on with buying the dip.
We’d say, not so fast. The out-of-control flood of stimmies from Washington is inducing a withholding of labor resources from the job market like rarely before. Consequently, some employers are actually paying workers to take job interviews, while the cost index for private wage and salary workers rose at a 4.5% annualized rate in Q1, the highest rate during this century to date.
Moreover, the Fed now claims to be on a white-of-their-eyes protocol, which means they won’t act prophalactically, but will wait for the inflation numbers to coming in smoking hot for a sustained duration before taking action.
That means, of course, that if the red bar on the far right margin is not transitory and repeats itself for several quarter running, it will be Kati-bar-the-door time. The Fed will find itself “way behind the curve” and will need to take abrupt, drastic action on interest rates, a scenario that today’s coddled punters are in no way prepared to endure.
Indeed, even Easy Janet Yellen’s passing hint today that interest rates may need to rise was enough the trigger the biggest tech stock sell-off in recent weeks.
Employment Cost Index, Annualized Rate Of Change, 2002-2021

In fact, it is worth recalling that nearly 25% of the market cap of the S&P 500 is attributable to just five monster tech stocks—Facebook, Google (Alphabet), Amazon (AWS), Apple and Microsoft. And a good share of their massive market cap gain in the last five years has been attributable to multiple expansion, which is claimed to be justified by persisting low interest rates which have gotten even lower over the period.
Thus, in mid-2016, the combined market cap of these 5 companies was $2.07 trillion, which represented an average 18.3X their combined operating free cash flow of $112.7 billion. By all historical standards, this mid-2016 valuation multiple on ultimate economic profits—free cash flow— was more than generous, even for market leaders with strong growth potential.
In fact, the above indicated combined free cash flow of the five companies actually grew by 16.5% per annum to $241.0 billion over the five year period just ended, meaning that the mid-2016 valuation multiple was pretty much spot on.
As of the LTM period for March 2021, by contrast, the combined market cap has soared by 4.4X to $8.14 trillion, while operating free cash flow rose by only 2.1X. The difference, of course, reflected multiple expansion, which soared to 33.8X or nearly double the 18.3X free cash flow multiple of mid-2016.
Needless to say, there was no appreciable acceleration of free cash flow growth after 2016, thereby justifying the doubling of the combined companies’ valuation multiple. Operating free cash flow for the five companies grew at about 13% per annum during the previous 5-year interval (2011-2016) or only slightly less rapidly than during 2016-2021.
In fact, in mid-2011 the combined market cap was about $928 billion (including Facebook at its 2012 IPO valuation), which represented a 14.4X multiple of their combined $64.3 billion of operating free cash flow.
So the picture is quite clear. The soaring valuation multiple of the five tech monsters accounts for a huge share of the market cap gain generated by these market leaders over the last decade.
Indeed, at the mid-2011 free cash flow multiple (14.3X), the combined market cap today would stand at just $3.45 trillion, not $8.1 trillion. Accordingly, fully 65% of the $7.2 trillion market cap gain of these tech sector behemoths since mid-2011 is due to multiple expansion, not the impressive but still modest 14.0% per annum growth of free cash flow over the 10-year period.
No matter how you cut it, even these formidable five businesses do not merit a 33.8X valuation multiple after a decade of growing at less than half that rate.

The ten-year chart below for Microsoft tells you all you need to know. Back in mid-2011, Microsoft’s market cap stood at just $224 billion and its LTM operating free cash flow clocked in at $24.6 billion. Accordingly, its implied valuation multiple stood at 9.3X, or barely one-fourth of today’s 35.1X free cash flow multiple.
But here’s the thing. During the next 10 years, Microsoft’s operating free cash flow grew at just 8.2% per annum.
Even more crucially, 83% of the huge $1.64 trillion gain in Microsoft’s market cap since mid-2011 is due to multiple expansion, not free cash flow growth.
So the question recurs. How does single-digit growth of economic profits justify an over-the-top 35.1X valuation multiple?
It obviously doesn’t, but it perhaps at least explains why Melinda apparently bit her tongue and toughed it out for another 10 years. After all, at the probably appropriate 9.2X free cash flow multiple of mid-2011, the company’s market cap would be just $495 billion, not today’s $1.864 trillion.
Stated differently, and perhaps more pertinently relative to the news of the day, Melinda’s cut would have been $19 billion rather than the $71 billion she now stands to collect.
We’d say good on her, but the larger point remains. There is a massive valuation bubble in the stock market—even among the giant tech monsters which have led the market ever higher.
And today’s action should be a warning: The bubble is overwhelmingly due to the false Wall Street claim that temporarily and artificially low interest rates justify a massively inflated capitalization rate on tech company earnings.
Among the numerous false narratives that the Fed’s lunatic money-pumping has generated over the last few decades, this one is among the most pernicious. As we will amplify on another occasion, America’s faltering real growth rate and vanishing main street prosperity is owing to the massive diversion of resources into financial engineering and speculation that the Fed’s Wall Street bubble has induced.
Microsoft Market Cap, Free Cash Flow and Valuation Multiple, 2011-2021

While we are at it, someone might well inform Tucker Carlson about the political implications, as well.
After all, the Bill and Melinda Gates Foundation and its principals are among the greatest public policy menaces on the planet. The boot heel of public health totalitarianism and the lunacy of the climate change war on CO2 have been literally nurtured by billions upon billions from the Gates’ alone.
Thanks to the Fed, they have an extra hundred billion dollars to support their benighted crusades—together or apart.
Perchance that startling reality might yet wake up the Foxified Right to the fact that the real enemy of liberty, prosperity and democratic self-governance in America today is not leftist wacko’s like AOC, but the monetary politburo known as the FOMC.