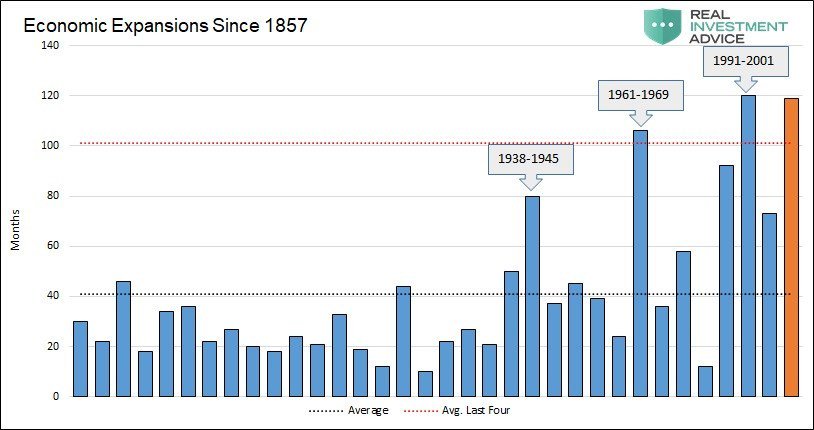
Welcome to month #118 of the second longest and hands-down weakest business cycle expansion in American history. Calendar-wise a new record for duration is just two months away, but cumulative growth of real GDP—-that is, what happened under the curve between the cyclical peaks—is an altogether different matter.
Back in 1960-69, the business cycle rolled over into recession after 105 months (3rd longest expansion), but during that period real GDP expanded by a hefty 51%. Likewise, during the 119 months of the record 1990-2001 tech boom, real GDP grew by 41% on a peak-to-peak basis.
This time, not so much. Assuming the current consensus of just under 2.0% annualized growth for Q1 2019 is roughly correct, the gain during the current cycle to date will be just 19.5%.
Now, the perma-bulls and Keynesians admonish not to sweat it. They essentially say that what the current expansion lacks in virility will be made up in splendid old age—-the implication being there is no recession in sight because the relevant benchmark is the 19.5% cumulative growth, not the octogenarianish 118 months of cyclical age.
But unless the powers that be have invented the macro-economic equivalent of Viagra, that palliative really doesn’t get you very far. What we mean is that real growth has oscillated around a 2% trend line during this entire expansion—-with undulations lower and higher driven by the syncopated credit impulses out of China and their impact on world trade, production and commodity prices.
Accordingly, it would take at least a 250 month-long expansion at this 2% real GDP trend to get back into the 40-50% cumulative growth zone for this current cycle; or, in the alternative, the aforementioned elixir that could spark the 3-4% growth boom that Kudlow & Moore fantasize about.
You only need to look at the chart below to rule out the 250 months with no recession scenario. Economic contractions happen owing to severe domestic and global economic shocks and due to policy mistakes by the fiscal and monetary arms of the state.
Needless to say, we absolutely do not believe that the world will be shock free for the next 10 years. One way or another there will be a catalyst that sends the US economy into the drink.
From the external world, it could be a thundering disruption of global trade from the collapse of the Red Ponzi’s $40 trillion tower of debt; or the global financial breakdown that would result were the BOJ to finally print Japan’s debt-ridden old age colony into an uncontrolled monetary meltdown; or even the trade and financial repercussions that would stem from the final bust-up of the EU owing to political turmoil or the demise of economies riven with socialist welfare statism and dirigisme.
Closer to home you have a central bank that ducked, dithered and delayed normalizing rates and balance sheets during months #40-#90 of the expansion—the usual time it has been done historically—and is now backed into a corner.
On the one hand, it desperately believes it needs to capture some head room to cut rates and goose its balance sheet for when the next crisis or recession hits. That is, so that it has the “dry powder” to do the Keynesian Stimulus thing—whether it has worked historically or not, which it hasn’t.
On the other hand, it is confronted by a Monetary Neanderthal Man in the Oval Office who will not hesitate to declare all-out political war on the Eccles Building should the truth of the so-called Trump Boom become undeniable. To wit, there never was a Trump Boom— just an artificial sugar high last summer that is now fading fast.
In short, the risk of a massive policy disruption at the Fed is higher than at any time since the 1970s. And that’s especially true if Trump’s two new political bomb-throwers—Stephen Moore and Herman Cain—actually get confirmed to the Fed and proceed to shatter the Keynesian groupthink consensus that keeps the day-traders and robo-machines of Wall Street hitting the “buy” key.
The chart below covers 162 years of American history and virtually 100% of the time since even the rudimentary semblance of an industrial economy emerged.
In light of this history and all of the factors mentioned above and many more like and similar headwinds, what we see on the right margin of this graph (yellow bar) is a cyclical expansion that is fast running out of runway.
For want of doubt, here is the track record of the past five years—three and change on Obama’s watch and two on Trump’s. Of course, we don’t think either occupant of the Oval Office had much to do with the annualized rate of real final sales growth for the 22 most recent quarters shown in the chart.
But what we do know is that the average 2.53% growth rate during the entire period was comprised of 2.46% growth during the Obama quarters and 2.59% during the Trump quarters.
That’s a rounding error no matter how you parse it, and is likely to get revised away over time, anyway.
The key takeaway, however, is that the Donald presided over one quarter of sugar high in Q2 2018 when the looming trade war caused foreign suppliers to pull forward US export shipments and domestic households to draw down their savings rate in order to enjoy a mini-spend-a-thon on the back of the Donald’s credit card financed tax cut.
That caused the annualized growth rate to surge to 5.2% in Q2, which was promptly given back the next quarter, when the growth rate plunged to 1.0% owing to a drastic drop in soybean and other exports and a rebound of the household savings rate.
To be sure, Obama also presided over a sugar high quarter or two—including the 4.9% real growth rate posted for Q2 2014—-when a Red Ponzi driven credit impulse temporarily caused global production, trade and commodity prices to surge. Two quarter latter, of course, the annualized growth rate was back to 1.2%.
The point is, when you take the inventory swings out of GDP and examine real final sales, there has been no acceleration whatsoever since Q4 2016. But what has happened is that a business cycle which at month #90 when the Donald took office was already long in the tooth has now used up most of its remaining runway.
As the Fed heads like to say, therefore, the balance of risks is way to the downside. And that’s evident even in the ballyhooed BLS monthly jobs numbers, which are the lagging indicator of all time.
Yet during the last 26 months on the Obama watch the monthly average gain was 215,000—a tad larger than the 199,000 jobs per month posted on what the Donald takes to be his monthly report card.
Here’s the thing. A business cycle that is getting exceedingly old and which is not accelerating, is an expansion that is heading hard upon it next rendezvous with recession.

Needless to say, the hope implicitly lingers on both ends of the Acela Corridor that some late cycle economic Viagra will yet make its appearance and reverse the drift toward recession.
After all, the market would not be pricing S&P 500 earnings at 23X if the next in rotation development was thought to be recession; and even the craven pols of Washington might not be looking at this year’s (FY 2019) $1.2 trillion/6% of GDP borrowing requirement with such equanimity if they understood the expansion runway is about to disappear.
Still, no one is espying a new double-digit growth boom in the Red Ponzi, pinned as it is under its $40 trillion mountain of debt and monumental levels of malinvestment. Nor are the talking heads pimping for a leap upwards from the flat-line or worse in Europe, an Un-Brexit miracle in the UK or a giant global “tax cut” owing to an impending collapse of oil prices back into the $30s.
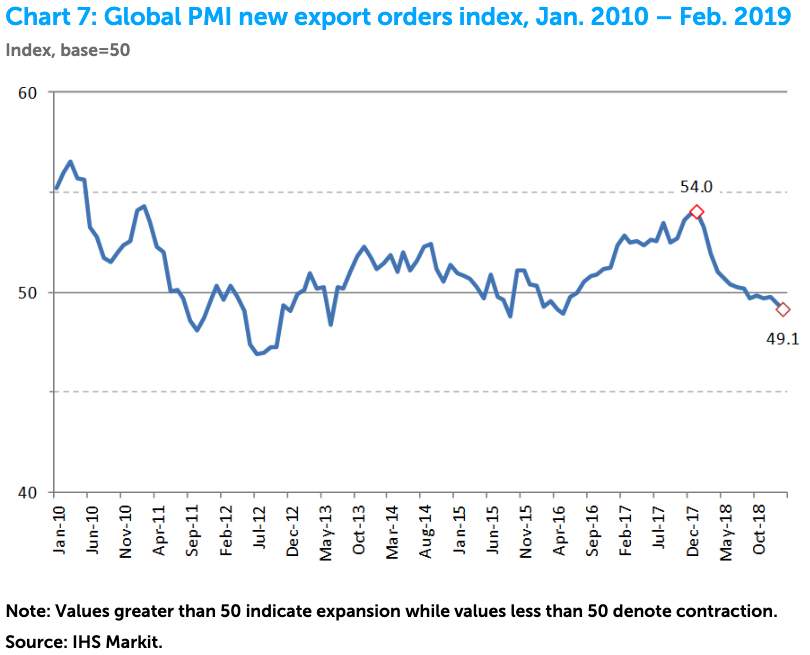
Indeed, the most recently reported data leave little to the imagination about the global growth cycle: it’s rolling over fast.
That is to say, any catalyst for late stage virility in the US economy has to be coming from the home front. Yet there are really only two candidates–wage growth acceleration and an investment boom. That’s because the Fed may well be “paused” in cowardly “patience”, but it’s not about to unleash a jolt of stimulus; and the fiscal machinery is positively paralyzed amidst the partisan warfare and rivers of red ink coursing thru Capitol Hill.
Once again, however, there is no sign of valid sustainable wage growth in real or inflation-adjusted metrics. To be sure, the sell-side stock peddlers are always cherry-picking monthly numbers where they can pair-up a strong nominal wage change with a weak CPI reading to thereby pronounce that the long-awaited acceleration of real wage gains has finally commenced.
Except it hasn’t. When you look at apples-to-apples comparisons as represented, for example, by median real weekly wages of full-time workers, there has actually been a slight deceleration. During the last three Obama years, average real weekly wage growth was a niggardly 1.3% per annum, and since than it has dropped to an average of 0.9% during the first two years under the Donald’s watch.
In fact, during the ballyhooed Trumpian Boom of 2018, real median weekly wages of full-time workers increased by just 0.65%—the weakest gain since 2014.
Needless to say, if the pay envelopes of the household sector are barely staying ahead of inflation that doesn’t amount to the Viagra needed to keep the expansion alive—nor does it add up to anything that remotely looks like MAGA.

Likewise, the vaunted Trump business tax cuts have been in effect for more than a year, and there is virtually zero evidence that they have stimulated anything except a tsunami of stock buybacks and vastly over-priced, economically pointless mega-M&A deals.
Thus, back in 2014 nominal GDP posted at $17.522 trillion and fixed business investment in plant, equipment, technology and intellectual property came in at $2.394 trillion—-meaning that the investment to national income ratio stood at 13.66%.
Of course, that was in the bad old days of Obama when the American economy was purportedly suffering from too much Big Government in Washington. But then came the GOP victory of 2016 and the sweeping Christmas Eve tax reform bill of December 2017.
Needless to say, the latter did not spare the loot when it comes to business taxes and incentives for investment.
During CY 2018 alone business taxes were reduced by $230 billion. This included $39.5 billion due to the new 20% business income deduction for pass-thru filers, $132.6 billion attributable to the 21% corporate rate, $16 billion for small business investment incentives and $41.6 billion for bonus depreciation (a form of 100% first year write-off of CapEx).
You might have expected that to pack an investment wallop because the 2018 business tax cuts amounted to 8% of combined corporate and proprietors pre-tax profits of $2.9 trillion. But you would be wrong.
It turns out that nominal GDP posted at $20.494 trillion in 2018, while business CapEx totaled $2.799 trillion. Accordingly, the ratio of investment to national income was, well, 13.66%—or identical to the second decimal place with the 2014!
Now we are not saying that the Obama policies were just as good as those of the Trumpite/GOP. Investment is driven by many things other than tax rates—-including the state of the global economy. And as it happened, the global economy was in a China credit impulse driven growth spurt in both 2014 and 2018 .
Still, all things equal you would expect there would be some return on the $230 billion of cash left in the coffers of corporations and unincorporated businesses during 2018 compared to pre-existing tax law. Yet as is evident from the chart below, the ballyhooed business tax cuts just did not move the investment needle materially.
To be precise, business fixed investment was 13.3% of GDP in 2017, 13.1% in 2016 and 13.5% in 2015 under slightly less favorable macroeconomic conditions. So for the four year period as a whole ( 2014-2017) business investment averaged 13.36% of GDP.
Under the most favorable possible assumptions, therefore, the ballyhooed Christmas Eve tax bill boosted business investment by the scant sum of 0.30% of GDP. In round terms that’s a $60 billion lift from a $230 billion incentive—amounting to a return of $0.25 on the dollar.
Obviously, you can’t grow your way out of debt on that kind of fiscal stimulus yield—-you just bury yourself deeper.
And most especially, that ain’t no kind of economic Viagra—just a 0.3% tickle to GDP, at best.
No wonder that the market blips upward every day on news of the pending China Trade deal, which we will dispatch tomorrow.
After all. There’s not much runway left—so only a miracle can save the dream-walkers on both ends of the Acela Corridor.
