So now the long delayed reckoning beckons. The Federal budget deficit hit 15% of GDP this year, and remain will above 10% of GDP for years to come. Yet even at the 5% of GDP run-rate of the Federal deficit in Q1 2020, there was no room left in the inn.
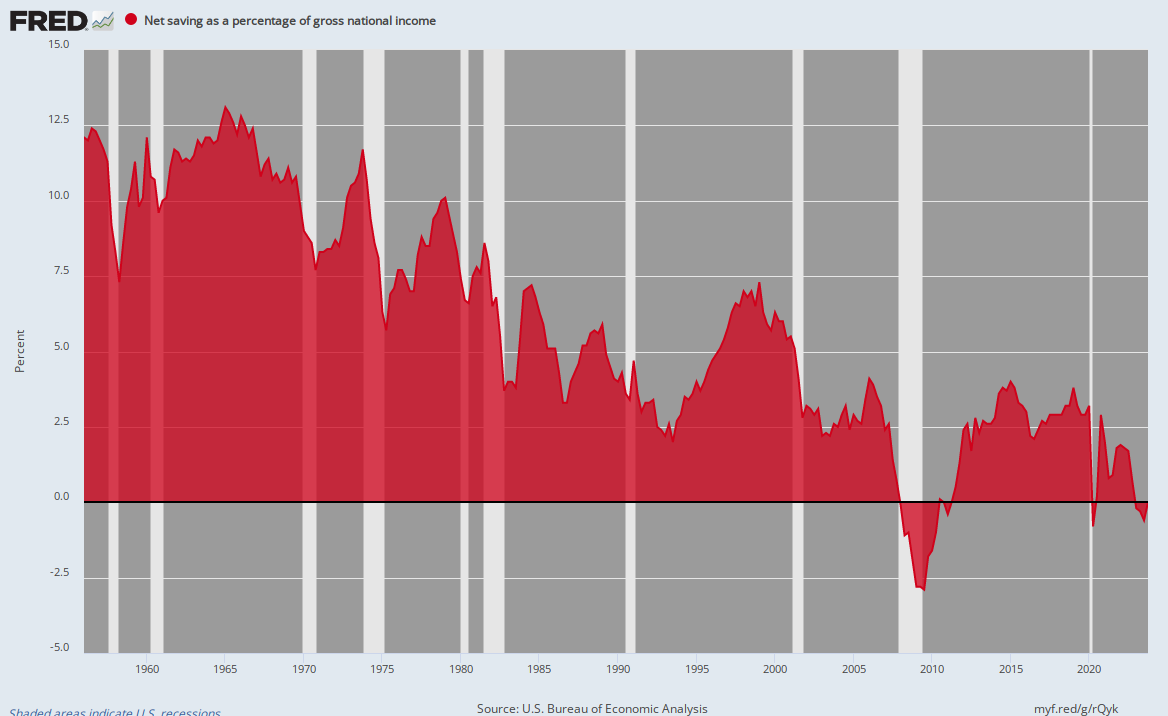
That is to say, net national savings, which represents private savings less the government deficit, has been reduced to -0.4% of GDP; and after a 50-year trek to the rock-bottom. So there wasn’t remotely any head-room to absorb the Donald’s phantasmagorical double digit deficits.
So the Fed will, apparently, just keep desperately printing fiat credit hoping to prevent an eventual bond market blow-up, which is inexorable.
Net Savings As Percent Of GDP
So what we now have is a national economy brutalized by Lockdown Nation and Washington-funded coast-to-coast soup lines based on no plausible or sustainable principles whatsoever except to wantonly deploy Uncle Sam’s credit card to, in effect, indemnify one and all against the economic collapse brought on by the state itself.
Thanks To The Trumpified GOP—Slouching To Fiscal Hell In A Hand Basket
The chart below compares the outstanding public debt with GDP since 1980, but with the enhancement that the public debt is stated at market value as calculated by the research department of the Federal Reserve Bank of Dallas. That removes the distorting effect over time of the Fed’s ever deeper repression of bond yields.
Since 1980, the nominal GDP—or national income from which the public debt must be serviced—has been in a losing race with the public debt. Thus, when the Gipper came to Washington to rollback Big Government and shrink the public debt, the latter stood at $864 billion or 28.9% of GDP, but since then it has been a one-way ratchet with GOP administrations leading the way ever higher.
The following is based on values at the end of each presidential term. It includes ending figures for nominal GDP, market value of the public debt and the public debt ratio, respectively:
- Carter at Q4 1980: $2.99 trillion of GDP $0.86 trillion of public=28.9%;
- Reagan at Q4 1988: $5.40 trillion of GDP $2.69 trillion of public debt=49.9%;
- Bush Sr. at Q4 1992: $6.68 trillion of GDP, $4.41 trillion of public debt=66.1%;
- Clinton at Q4 2000: $10.44 trillion of GDP, $5.98 trillion of public debt=57.3%;
- Bush Jr. at Q4 2008: $14.65 trillion of GDP $11.56 trillion of public debt=79.4%;
- Obama at Q4 2016: $19.03 trillion of GDP $20.38 trillion of public debt=107.1%;
- Trump at Q4 2020: $21.48 trillion of GDP, $29.84 trillion of public debt=138.9%.
When we said the GDP is in a losing race with the public debt, it’s because a 40-year trend doesn’t lie. During the past four decades, in fact, the GDP is up by 7.2X while the mark-to-market public debt has soared by 34.5X!
The army of fiscal flakes and careerist pols who dominate today’s GOP would have you believe, of course, that the explosion of the public debt from 28.9% of GDP in 1980 to the current precarious reading of 139% during the quarter ended in December 2020 is all the fault of the big spending Dems.
But the figures do not lie on that matter, either. Fully 91.1 percentage points of that 110.0 percentage point gain in the debt ratio has occurred during the 24 years of GOP White House incumbency between 1980 and 2020. That is, 83% of the gain is attributable to GOP presidents and 17% to the Dems.
Nor does the lame GOP excuse that Democratic congresses obstructed the good intentions of GOP administrations wash. Republican presidents had 24 years’ worth of opportunities to veto spending bills and entitlement expansions, but essentially vetoed nothing material except in the early days of the Reagan Administration.
Likewise, the excuse that spending for baseline entitlement programs like social security, the medical entitlements and other welfare programs keeps rising due to higher case loads and benefits levels doesn’t wash, either. The leverage to force entitlement cuts and reforms has been the debt ceiling, which has also been increased by more than 30 times since 1980, as well.
Yet Republican presidents during the last 40 years have never once vetoed a debt ceiling increase, owing to the sheer cowardice of the GOP rank-and-file on both ends of Pennsylvania Avenue.
So the scorecard is what it is, and it also tells you why a Fiscal Armageddon is virtually guaranteed during the coming decade. The Dems are spenders, statist and overwhelmingly political careerists, yet there is obviously no remaining semblance of an Opposition Party when it comes to the nation’s fast approaching fiscal ruin.
For want of doubt, here is the average percentage point gain per year in the debt-to-GDP ratio since 1980.
Average Percentage Point Gain Per Year:
- Clinton/Obama years: 1.2 percentage points;
- Ronald Reagan years: 2.6 percentage points;
- 40-year average: 3.0 percentage points;
- Bush the Elder & Younger: 3.2 percentage points;
- Donald Trump years: 8.0 percentage points;.
That’s right. The debt ratio had been ratcheting-up for decades, but during the 48 months of his misbegotten tenure, the Donald literally turned on the after-burners.
And, yes, it is overwhelmingly Donald Trump’s fault owing to the fact that:
- The insane $160 billion annual increases in defense spending was apparently his pride and joy;
- He gladly threw in the hopper upwards of $100 billion in additional domestic pork barrel spending to get his defense budget increases;
- The un-funded $1.7 trillion tax cut was aggressively promoted by the White House based on growth theories that were preposterous on their face; and,
- The $4.0 trillion spending spree through the end of December (with trillions more coming) to counteract the economic devastation of Lockdown Nation was doubly the Donald’s doing: He encouraged nearly every dime of it and also unleashed Dr. Fauci and the Virus Patrol in the first place, while exhibiting no comprehension or backbone whatsoever after this mistake became blatantly evident months ago.
Market Value Of The Public Debt Versus GDP, 1980-2020

The Real Fiscal Culprit: Endless Easy Money and Massive Monetization of the Public Debt
As culpable as the Donald obviously is on the spending and borrowing front, he has also pushed off the deep-end the underlying reason for the catastrophe at hand. Namely, the destruction of fiscal democracy during the last four decades that is an inexorable consequence of the Fed’s systematic and drastic falsification of the price of debt.
That changed everything after 1980, and is the reason why today’s rapid slide toward disaster is absolutely something new under the sun. In fact, the pre-1980 history of the public debt burden proves beyond a shadow of a doubt that it is easy money, not just the inherent fiscal profligacy of politicians, that accounts for the massive run-up of the public debt burden since 1980 shown above.
The truth is, until 1980 the public debt burden tended to soar during periods of wartime or crisis, but then was paid-off and ratcheted-down during the subsequent decades of peace and prosperity.
The first great bulge occurred during the Civil War when the public debt reached $2.5 billion in the dollars of the day, compared to a GDP of about $5 billion by 1870. The implied public debt ratio was 50% of GDP at the post-Civil War peak, but then something quite remarkable happened during the 43 years of peacetime between 1870 and 1913.
To wit, the Federal budget was in surplus 30 out of those 43 years!
This permitted the public debt to be cut in half to $1.2 billion by 1913. Meanwhile, the GDP had soared to $39.6 billion in dollars of the day, meaning that the debt-to-GDP ratio had been slashed to just 3.0% of GDP by the eve of the Great War.
During those 43 years of prosperity, real GDP had grown by 4.6% per annum, and per capita living standards had gained 2.5% per year—a level far higher than anything recorded since then.
That is to say, American fiscal democracy had no inherent death wish during the pre-Fed era. Back then, the cost of the public debt was palpable, while freeing-up the national savings pool to fund private sector investment produced its own validation in the form of robust economic growth.
Unfortunately, then came Wilson’s Folly and the madness of US entry into a European fratricide that had no bearing whatsoever on the security and liberty of the American nation, lodged as it was between the great ocean moats. But by the time the slaughter had finally stopped in the killing fields of France, the US public debt had soared to $25.5 billion to fund the war and to underwrite Wilson’s bankrupt European allies (France and England).
So now the debt was back to 30% of the $84.0 billion of GDP at the end of the war (1919), but once again America’s fiscal democracy proved its mettle when Republican government, still possessed of the old time fiscal religion, slashed both wartime spending and taxes.
By 1928, the debt had been rolled back to just $17.6 billion, which amounted to just 18% of the $97 billion of GDP recorded in the last year of the Roaring Twenties boom.
We’d call that real supply-side policy, as distinguished from the bogus theories of Art Laffer, who 50-years later named a curve after himself. The latter claimed that tax cuts alone would pay for themselves and that GOP politicians need not bother with the messy business of cutting spending and curtailing the free stuff implicit in the post-war growth of the US Welfare State.
But, still, here’s the dispositive but rarely acknowledge truth which demonstrates that even the rise of both the modern Welfare State and Warfare States alone did not alone bring about the ruin of American fiscal democracy. It was bad money and bad money mainly which did the evil deed, and when it comes to bad money, Donald Trump is the very avatar thereof.
Thus, on the eve of Franklin Roosevelt’s ascension to the Oval Office at the end of 1932, the public debt had risen modestly to $19.5 billion, despite Herbert Hoover’s claim to being a budget-balancing conservative, while the nominal GDP had plunged to $58 billion owing to the Great Depression.
What that means is that we started the modern era of the Welfare State in 1933 (and soon thereafter the permanent Warfare State after WWII) with a public debt ratio of 33% of GDP. But the next 48 years of fiscal history you will not find anywhere in contemporary GOP oratory, and only unflattering references to it in the Keynesian textbooks.
That’s because notwithstanding the huge fiscal expansion of the New Deal, the massive military spending for WWII and then the Cold War thereafter and the further fiscal excesses of the Great Society and the 1970’s spend-a-thons under Nixon and Carter alike, the public debt ratio ended up back where it started!
That’s right. After 13 years of the New Deal and the massive borrowing for WWII, the public debt had soared by 13X to $270 billion, where it amounted to 127% of GDP by the end of 1945.
But then the debt ratio marched down hill again, pretty much steadily outside of LBJ’s “guns and butter” interlude in the mid-1960s, to the 28.9% ratio the Gipper inherited in 1980. And that happened because there was still enough of the old time fiscal religion on Capitol Hill and especially among the GOP to enable the post-war growth of GDP to out-run the rise in the public debt—notwithstanding the drift of policy toward fiscal deficits most years, albeit moderate ones generally amounting to less than 2.0% of GDP.
No more. As shown above, the race has now been decidedly lost, with the public debt (at market value) now weighing in at an unprecedented 139% of GDP and gaining momentum rapidly. Indeed, even if the Covid/Lockdown Nation disaster miraculously vanishes in the years just ahead, the tsunami of 10,000 baby boomer retirements per day during the 2020s will supply the fiscal coup d’ grace.
The Real “V” Ahead: The Baby Boom Retirement Driven Explosion of the Welfare State
So, yes, there is a V-shaped thing looming in the decade ahead, but it’s not the one the Donald and his minions bragged about before they were shown the door by the American electorate. What is soaring like a rocket is the gross Federal debt which currently stands at $28 trillion and which will easily cross the $42 trillion mark well before calendar year 2030 has ended.
Unfortunately, Sleepy Joe and his reinstated Government Party doesn’t have a clue as to the fiscal disaster he was gifted by the Donald. That’s because Trump’s tenure encompassed absolutely the worst years to sabotage the budget with huge unfinanced tax cuts and spending surges and to monkey-hammer the US economy with the folly of Lockdown Nation and its evisceration of all remaining remnants of fiscal discipline.
We are referring to the fact that the 2020’s were already baked into the cake as the decade of fiscal reckoning owing to the tsunami of baby boomers hitting the retirement rolls. At the present time there are 56 million American 65 or older but by 2030 that number will soar to 73 million, and then keep climbing from there.
The plain fact is that a dangerously weakened economy carrying a staggering burden of public and private debt will not be up to the task of funding the automatic growth of social insurance and other welfare state benefits for the elderly.
Even under CBO’s unduly optimistic assumptions, annual spending for the major Welfare State categories will rise as follows between FY 2020 and FY 2030. In all, what costs $2.66 trillion today will $4.47 trillion or nearly 70% more by then:
- Social Security: $1.091 trillion to $1.835 trillion;
- Federal civilian and military retirement benefits: $173 billion to $227 billion;
- Medicare: $862 billion to $1.61 trillion;
So did we say that the Donald’s tenure was malefic from a fiscal point of view?
We certainly did and there are no “fact checkers”, even in Silicon Valley who can prove otherwise.