There are apparently a few incorrigible permabulls celebrating the 0.2% drop in the Y/Y CPI this month, but as usual they are missing the point.
To wit, April was the seventh straight month in which the Y/Y CPI rose by more than 6%, and on that high plateau household budgets and savings can get pulverized. If sustained for three years, 6.0% inflation results in a 17% loss of purchasing power, after five years the loss is 27% and after 10-years the loss is 46%.
So what today’s report really showed is that inflation has already reached a dangerous interim plateau. And that’s before we get to double-digit rates of annual increase, which most surely are storming up the pipeline.
Y/Y Change in Headline CPI:
- October: 6.22%;
- November: 6.81%;
- December: 7.04%;
- January: 7.48%;
- February: 7.87%;
- March: 8.54%;
- April: 8.26%
One indicator of continued upward inflationary pressure is that both food and shelter components, which in combination account for 46% of the weight in the CPI, continue to trend upward at a brisk pace.
Since last October food prices have jumped from 5.33% on a Y/Y basis to 9.38% in April. At the same time, the shelter index has accelerated from 3.38% to 5.14%.
Y/Y Change In CPI Food And Shelter Indices, October 2021-April 2022

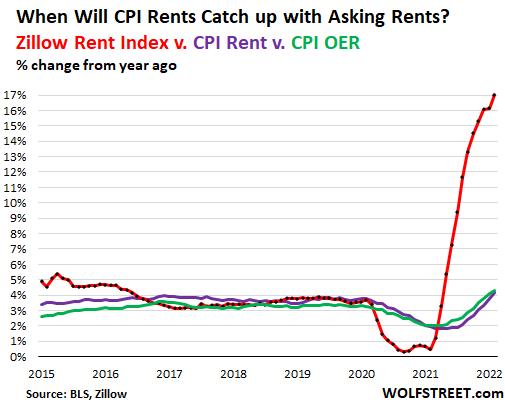
Needless to say, the rising bars above are not the end of the food and shelter surge. For instance, the Y/Y rises during April in the OER (owners equivalent rent) and primary rent index were 4.79% and 4.82%, respectively. Yet the highly regarded Zillow rent index was up 17% in the most recent month.
Owing to the lag-times built into the BLS rent collection process, however, it is only a matter of time until these two BLS shelter components close the gap with market-based data. And these two items alone account for 31.4% of the headline CPI.
Likewise, food is in the midst of the most virulent inflationary surge since the 1970s. On a year-over-years basis, these are some of the pressures evident in the April CPI report:
Year-Over-Year % Change:
- Fish: 13%;
- Beef: 14%;
- Coffee: 14%;
- Milk: 15%;
- Chicken:15%;
- Bacon: 18%;
- Eggs: 23%;
- Wheat flour: 33%;
Needless to say, the above figures represent inflationary pressures that have already made their way to the supermarket shelves. But reaching further upstream to the PPI and commodity indices for foods reveals that the CPI food indices have by no means peaked.
At the commodity level, the global food index is still up by 28% versus prior year—a figure which may well accelerate substantially over the balance of the year if the soaring price of fertilizers leads to the predicted cutbacks of farmer applications and therefore materially reduced yields this fall.
Further downstream at the producer price level, the list of items growing at double digit rates continues to lengthen, meaning that any abatement in the rise of supermarket prices is a long way off.
Y/Y PPI Component Change:
- Spaghetti/Macaroni: 10.3%;
- Lettuce: 12.0%;
- Milk: 16.4%;
- Orange juice: 17.2%;
- Ham: 17.7%;
- Butter: 17.9%;
- Bacon: 19.4%;
- Chicken: 20.3%;
- Beef: 24.2%;
- Sugar: 32.2%;
- Eggs: 33.8%;
- Hot dogs: 37.1%;
- Lamb: 43.8%;
- Soybean oil: 60.7%;
- Coffee: 70.6%
Y/Y Change Global Food Price Index

An anchor to the windward in the overall CPI recently has been the temporary dip in services prices which occurred during the heavy lockdown months of 2020. Compared to trend increases centered around 2.5% during the recovery years between 2012-2019, the CPI services components slipped to as low as 1.3% on Y/Y basis in January 2021.
But that boon resulting from state-ordered cessation of activity in the social congregation venues is now well in the rear-view mirror. Compared to a 2.63% Y/Y gain in April 2021, last month the overall services index rose by 5.37% or double its year ago rate. And services account for 62% of the CPI.
Y/Y Change In CPI Services Index, 2012-2022

An illuminating example of this temporary dip and then robust recovery in the services sector is provided by the transportation services sub-index. Owing to the shutdown of air travel and much of mass transit during the spring and summer of 2020, the transportation services index dropped to -8.7% at the May 2020 bottom and remained negative on a Y/Y basis until February 2021.
But now the re-opening of activity has permitted fares and prices to more than recover. Air fares alone were up by 33% in April, while transportation services overall rose by 8.5% on a Y/Y basis. Again, the story is not so much the April 2022 gains as it is the elimination of the one-time Covid-Lockdown effects which temporarily freighted down the overall CPI.
Y/Y Change In Transportation Services, January 2019 to April 2022

The historically inflationary medical services sector displays the same pattern in spades. After rising at a 3.1% per annum rate between 2012 and February 2020, the onset of the Covid era literally caused the index to perform somersaults.
Initially, it soared to a 6.0% Y/Y rate by June 2020 in response to the flooding of the health care system with Covid cases, but then entered a sharp plunge as large swaths of discretionary health services were ordered suspended by the Virus Patrol. By the June 2021 bottom the Y/Y rate had fallen to just 0.8%, the lowest level since the 1950s.
Needless to say, that anchor to the windward on the CPI was not meant to last. As of April 2022, the year-over-year gain is back up to 3.5%, and has every probability of going higher, not lower.
Y/Y Gain In Medical Services CPI, 2017-2022

That’s especially the case because labor rates are now soaring. For the health care sector overall the employment cost index was up by 5.6% Y/Y in Q1 2022 and is heading higher owing to double digit gains in costs for nurses and other health care workers in short supply.
The chart below shows the step-change now underway. Between Q3 2009 and Q4 2019 health care compensation costs rose by 2.0% per annum. We’d estimate that by the end of Q2 2022, however, the Y/Y rate of gain will be triple that at 6.0% or higher.
Given that compensation is by far the largest cost for health care providers, they will have no choice in the months ahead except to raise prices and fees on a commensurate basis.
Y/Y Change In The Employment Cost Index For Health And Social Assistance Workers, 2009-2022

In all, the April CPI report reminded once again that we are in a wholly new inflationary ball game. In the great scheme of history, it turns out that 2012-2019 was an aberration, owing to the one-time shift of production to low-cost global supply chains and the massive global money-printing spree of the central banks that provided ample cheap debt capital for global infrastructure, raw material, manufacturing and transportation investments.
As a result, the overall CPI averaged just 1.6% per annum owing to negative inflation in durables, tiny trend increases for commodities and nondurables and 2.6% per annum Y/Y increases for services. By contrast, the Y/Y gains reported this AM for April 2022 are in a different ball park.
The Fed’s phony era of “lowflation” is over and done.
2012-2019 Per Annum Increase Versus April 2022 Y/Y Increase:
- CPI Durables:-1.0% vs.+14.0%;
- CPI Nondurables: +0.3% vs. +12.8%;
- CPI Services: +2.6% vs. +5.4%;
- Overall CPI: +1.6% vs.+ 8.3%
Y/Y Change In CPI And Its Major Components, 2012-2022

In short, we can see no near-term relief from the perfect storm depicted above. Both the China Covid-crackdowns and the Ukraine War will continue to roil supply chains and commodity markets, while domestic services are off to the races owning to fiscal policy induced labor shortages and the resulting rise of cost-push inflation in the services sector.
On the other hand, the Fed made its bed of excess demand over years of unhinged money-printing. Now it has no choice except to tighten far more aggressively and far longer than expected by Wall Street and Washington alike.
Of course, the head of inflationary steam described above will eventually be relieved. That is, by the age old cure of recession and a doozy at that.