We are not sure which is more ridiculous: The Donald’s claim he has produced the Greatest Economy Ever or the Wall Street meme of the moment holding that the Fed has just successfully navigated a mid-cycle adjustment and that the US economy is now good for another spurt of growth.
What we do know, however, is that this is surely the Mother Of All Suckers’ Rallies.
The US economy is a flat-out, end-of-the-cycle mess. Both fiscal and monetary policy are far off the deep-end and have nowhere to hide, and even the highly manipulated corporate earnings are heading for their fourth straight quarter of year/year decline.
But above all, the trade war is essentially being institutionalized, not won or ended or even Phase One’d. That’s the real meaning behind still another headline in the wee hours last night that a China Trade Deal is at hand.
It is not. To the contrary, when the horribly over-valued stock market rallies 300 Dow points on a leak from Beijing that says essentially that the Donald is folding his beloved Tariff Tent, we have truly reached the point of Maximum Imaginable Credulity.
It’s as if even the Chicoms have figure out that if they can induce the robo-machines and day traders to push the stock averages ever higher into the financial stratosphere, they will soon have an election-minded Trump by the short orange hairs.
That part may be true, of course. But, again, what does the latest rumor of a trade war truce have to do with MAGA?
When you cut through the Fake News clutter, what is actually pending is just a desperate effort by the Donald to save his bacon in Wisconsin and Iowa, without which he’s heading for a new abode after January 2021—and one far less commodious than Trump Tower or Mar-A-Lago.
To be sure, there will be some bells and whistles about the largely phony issue of intellectual property theft, playing nicer to US companies when they chose to locate in the Red Ponzi and a Beijing promise to forgo “currency manipulation” (i.e. what all central banks do including the Fed). But the whole thing will actually amount to little more than a Nothingburger designed to put some farm-state electoral votes back in the Red column.
Indeed, you could call the emerging package an exercise in selling a used car twice and be done with it. That is, China will commit to buying a bunch of farm goods—which are the same ones they were buying three years ago, and have since jettisoned in retaliation for the Donald’s insane imposition of $79 billion of tariffs taxes on $360 billion of Chinese industrial and consumer exports to the US.
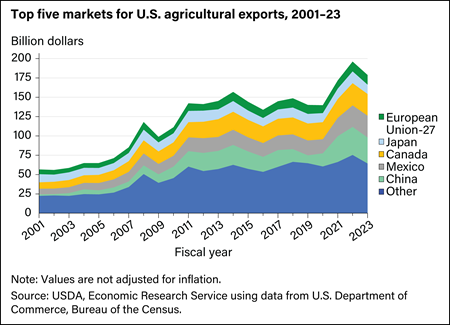
The fact is, US farm exports to China peaked at $29 billion in 2013 and were still posting at $24 billion (2016) when the Donald was elected. Alas, by 2018 they were down to $13 billion owing to the near total collapse of soybean exports to China (red portion of the 2018 bar) and are now running at less than $9 billion on an annualized basis.
That’s actually losing so much that farm state voters can’t stand it. Recoupment of some of that loss, therefore, is the sum and substance of the phony Phase I trade deal possibly coming down the pike.
After several years, maybe US farm exports to China can get back to $25 or even $30 billion under the pending deal and partial mutual tariff rollback.
But how does partially restoring the status quo ante in the tiny slice of US GDP (0.13% in 2016) accounted for by farm exports to China do anything to help the aging, struggling $21 trillion US economy?

Indeed, as we pointed out a few weeks ago, farm exports are totally fungible on the global market. The overwhelming share (85%) of the $59.3 billion of soybeans exported to world markets in 2018, for example, were accounted for by Brazil at $33.2 billion and the US at $17.2 billion. The next two largest exporters were Canada and Paraguay with barely $4 billion between them.
So if the pending Phase 1 truce results in China boosting its US soybean purchase from last year’s $4 billion to say $15 billion, it would only result in the swapping out of end markets between Brazil and the US.
That is, approximately $11 billion of Brazil’s $27 billion of soybean exports to China last year would end up in other Asian and European markets. At the same time, a more traditional share of all of US soybean exports would be shipped to China (i.e. 60% vs. 30% per the plunging blue line in the chart below).
The math basis for that outcome is also clearly evident in the chart. US soybean exports to China (red portion of bars) peaked at about 1.3 billion bushels in 2016 and then plunged by almost 900 million bushels in the most recent year (2018-2019 marketing year). But total US soybean exports dropped by barely 40% of that amount or 400 million bushels. The difference just went to other end markets (grey portion of the bars) formerly occupied by Brazilian shipments.

Indeed, the only thing the Donald’s idiotic Trade War has done for to the US farmer is to accelerate the investment in additional Brazilian soybean acreage and production/export infrastructure that was already underway. In fact, when the 79 million metric tons of Brazilian export for 2019 shown in the chart below are translated into bushels, it appears that Brazilian exports have risen by 600 million bushels since 2016.
That is, Brazil has picked up the net US worldwide loss of 400 million bushels plus another 200 million bushels of global market growth. If nothing else, that suggests that winning trade wars is not nearly as easy as the Donald boasted it would be.
This same fungibility factor is true of the potential for beef and pork export increases to China (purple portion of the bars in the US farm export chart above).
During 2018, the US exported $8.3 billion of beef to world markets and $6.4 billion of pork. However, $9.0 billion (61%) of that $14.7 billion total went to Japan, South Korea and Mexico—the three leading US meat export markets. By contrast, only $1.8 billion went to Hong Kong/China.
So what is mainly going to happen under the pending “win” for US farmers is the swapping of end markets with other meat exporters, such as Argentina. Indeed, since the year 2000, combined US beef, pork and poultry production has risen by only 1.1% per annum, meaning that total supply is not likely to get up on its hind legs and suddenly leap higher.
Instead, if China’s beef and pork imports were to quadruple from say $1.8 billion to $8 billion owing to Beijing’s mandate to its purchasing managers, most of that gain would come out of current U.S. exports to Japan, South Korea and Mexico. In turn, the latter would likely be supplied by other US meat export competitors who would be displaced from China.
Needless to say, all of these considerations relate to merely restoring the status quo ante with respect to US farm exports to China ($25-30 billion), and perhaps a related modest boost to total US farm exports.
Beyond that, the larger target of $40-$50 billion of farm export to China that will be ballyhooed for Phase II is a pipe dream: There isn’t remotely that much elasticity in the US farm supply base as shown by the chart below.
For the last eight years, total US agricultural exports—including sugar, fruits/flowers, livestock/meats, cotton, soybeans and grains—have hovered in the $140 billion range. To bump exports to China from today’s $10 billion to $50 billion would require either a huge reshuffle of end markets at no or little net gain in total farm exports—-or a 30% gain ($40 billion) in aggregate exports that is not remotely in the cards.
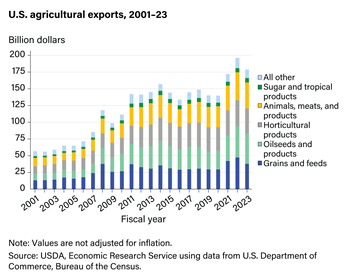
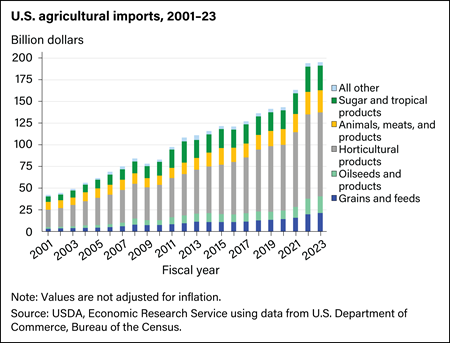
Moreover, exports per se are not the only variable–even on the farm front. It so happens that in 2018 the US also imported about $125 billion of ag products in the same categories as shown above, including $65 billion of flowers, fruits and other horticultural products.
The real farm trade puzzle, therefore, involves $265 billion of turnover, and a modest $15 billion surplus as of 2018. So it is even conceivable that an artificial deal-based boost in farm exports to China could result in an off-setting rise in US imports of some of these same products to backfill the domestic market. The identical color-coding scheme by product group for US farm imports is shown below.
In any event, the relevant quantitative variable is improvement in the tiny $15 billion farm trade surplus posted in 2018—meaning that even a big relative gain wouldn’t amount to a hill of beans in the scheme of things.
Back in 2012, for instance, the farm trade surplus was about $35 billion. So even if that level were to be recovered a couple years down the road via enhanced exports to China not offset elsewhere, the gain to GDP would amount to the microscopic sum of 0.1%!
Indeed, as shown in the chart below, China is a small part of the $140 billion end market for US farm exports. The Donald foolishly thought that winning trade war was easy, but what he has actually accomplished has been to throw his most loyal constituency (the red farm states) under the bus.
The pending phase I “deal”, therefore, is actually about stopping the traffic so that the victims can be evacuated on stretchers and nursed back to health.
That’s not winning, of course. It’s just plain stupid.
Meanwhile, the US taxpayers will soon be permanently on the hook for the upwards of $50 billion that the Donald has borrowed in order to subsidize US farmers for the inconvenience of being thrown under the bus. And there is no question about that aspect at all: It’s flat out loosing.
Nevertheless, the 40th version of the China Trade Deal is just one piece of the Maximum Imaginable Credulity now levitating the casinos.
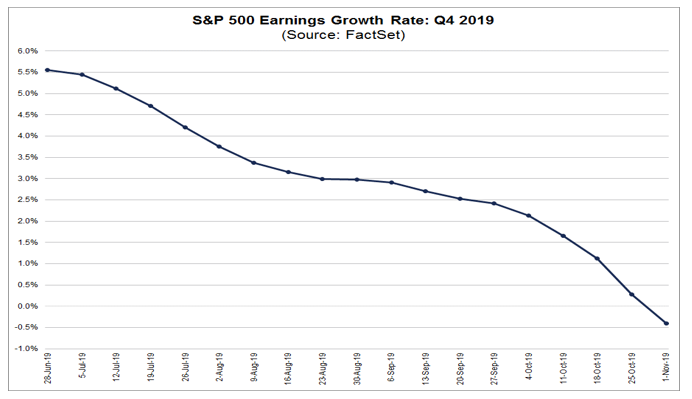
We also now have the “earnings beat” scam ramping at full force. After three straight quarters of year over year declines, including a 2.3% drop in S&P 500 earnings for Q3 (with 75% of companies reporting), the ballyhooed turn-around was supposed to happen in Q4.
Indeed, as recently as June 30, the S&P 500 estimates for Q4 stood at +5.5% versus prior year. But now, barely 140 days latter, the consensus estimate is -0.5% and heading south, fast.
True enough, this “lower the bar and beat on the release” game has been going on for years, but here’s the thing: When you are at month #125 of the longest and most fragile business expansion in history, you are living on borrowed time. You do not have unlimited runway to chase the earnings hockey stick into the indefinite foggy future.
Yet at today’s close (3085), the S&P 500 stood at 23X the $134 per share of earnings posted for the September LTM period; and actually at 25X earnings when you adjust today’s LTM earnings to the higher corporate tax rates which prevailed prior to December 2017.
What we are saying is 25X earnings during the young stages of a business recovery in the context of a healthy main street economy might make sense. But 25X earnings being generated by today’s faltering octogenarian is about as credulous as it comes.
On still another gradient, we don’t see anything “mid-cycle” about the current situation from a calendar-wise viewpoint, either. And that’s regardless of whether the tepid US economy is ticking slightly higher or lower in the near-term.
To the contrary, we are obviously in an heretofore uncharted “old age-cycle” at 125 months of expansion and also 125 months of the greatest accumulation of debt, malinvestment and main street versus Wall Street prosperity imbalance in recorded history.
To use an apt metaphor, age does not become her when you are talking about a capitalist economy and business cycle that is being man-handled and artificially extended by massive monetization of the public debt and the complete falsification of interest rates and financial asset prices in all sectors of the financial market.
Indeed, it is massive debt and fake asset prices that is putting the lie to both the Trumpian and Wall Street narratives. Never before have the laws of sound finance been so egregiously violated and over such an unprecedented stretch of time.
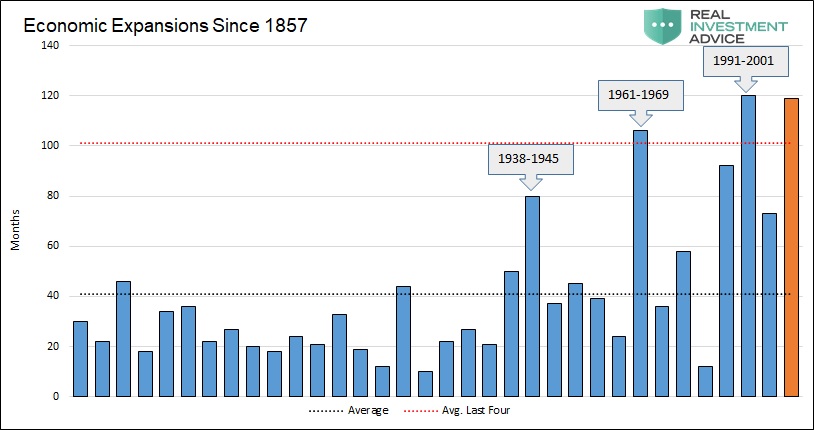
So the chart below is not only about the time dimension of the current business cycle compared to all those which have gone before. More importantly, it’s about the accumulated risk and rot that lurks beneath the time axis in the chart: None of the historical blue bars below sported a level of economic metastasis that remotely compares to what has built-up under the brown bar since 2008-2009 .
In fact, the underlying domestic and global economy at 125 months of expansion is so unstable and impaired that the market should be sharply discounting the future by a drastic shrinkage of PE ratios rather than extending them to all-time highs.
Finally, still more “incoming data” puts the lie to the Greatest Ever Economy resident in the Donald’s delusionary imagination. What he doesn’t get is that the business cycles are linear and cumulative.
So, naturally, with the passage of time there are more jobs, less unemployment as measured by the BLS and more GDP. But that’s what capitalism does when its not being excessively monkey-hammered by the state.
But when the free market is being assaulted and impaired by state fostered build up of debt, speculation, malinvestment, misallocation and economic waste, the passage of time is something to fear, not to boast about. That’s because what eventually comes is the reckoning and the collapse of the rot and excess which have build up down below.
That’s surely just around the corner, but in the interim it needs be noted that even in the final months of an aging business cycle that the Donald inherited in month #90, there has been no acceleration or improvement at all.
With 11 quarters now posted, average real GDP growth on the Donald’s watch now computes to 2.57% per annum. As it happened, under Obama’s last 11 quarters the CAGR computed to 2.58%.

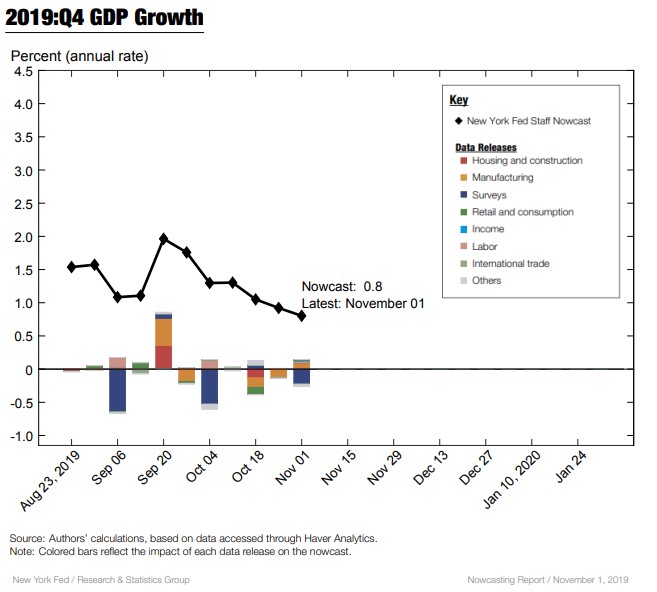
Needless to say, a 0.1% loss is a rounding error at best, and certainly ain’t something to boast about. Especially when it looks like the next GDP reading will be post at less than a whole integer—or the stall speed that precedes the bust.
As we said, maximum imaginable credulity is what you have when the robo-machines are taking Beijing’s word for it—-and especially when the Chicoms have the Donald by the short orange hairs and he’s got his hand on the ignition pin.