We are now seeing the fetid fruits from 30-years of the Fed’s relentless coddling of Wall Street. Swings of 1,000 Dow points intra-day, day-after-day and sub-1% yields on nearly the entire Treasury curve bespeak of a financial market that is completely broken. Kaput!
To be sure, there probably should be 1,000 Dow point moves, but the direction would be consistently down. The so-called “market” was easily overvalued by 40-50% at the recent peak (29,557 on Feb. 12), so the sellers still have mucho wood to chop.
The reason we insist upon this is actually the absurdly low yields in the treasury bond market themselves, which have enabled the permabulls to promote the greatest tautology ever invented. They say that Treasury yields are at all time lows, so, ipso facto, equity PE multiples should be at all-time highs.
But that assumes the 10-year UST at 0.91% today is even remotely rational, sustainable or has anything at all to do with financial logic or the state of the domestic and global economy. It doesn’t!
To the contrary, relative to their basic character as fixed price income yielding securities, bonds are in an even more fantastic central bank fostered bubble than the stock market. David Rosenburg hit the nail on the head in that regard when he recently noted that,
The total return in zero-coupon bonds in the past 12 months is an eye-popping 56%!! For plain-vanilla 30-year Treasuries, the total net return is a hot 40%.
Folks, that’s the smoking gun right there!
In a 2% +/- inflation environment, government bonds are supposed to generate returns of 3-5% through interest payments with no price appreciation at all. The fact that long-term UST’s have generated returns 10X to 14X larger than that tells you all you need to know.
Namely, that what is supposed to be the valuation benchmark for equity capitalization rates is nothing more than another speculative up-welling in the vast sea of liquidity that has been foolishly pumped into the financial markets over the last several decades by the Fed and its fellow-traveling central banks.
Stated differently, bond yields are crashing and heading for the zero bound not because investors are discounting a weak economy or any kind of economy at all. This is just unadulterated, foaming-at-the-mouth style speculative mania. Bonds prices are soaring and yields are plummeting because leveraged speculators gorging on the Fed’s 1% repo (see below) are chasing them up.
The fast money talking heads who come on bubblevision inadvertently admit as much. When asked what they are buying, they say “duration”.
Well, duration isn’t an asset class and buying it under today’s circumstances is a rank speculation, not an investment or even a trade.
In a stable free market, you couldn’t make money buying “duration” because bond prices would barely deviate from par. Yes, you might want to take on more duration risk for slightly better yield, but that’s an investment trade-off, not a route to double-digit price appreciation.
So forget the bond bubble excuse for today’s towering PE multiples. Since the latter are essentially the capitalization rate by which the projected stream of future earnings from equities need to be discounted back to the present in order to arrive at the appropriate share price, the real question is altogether different: Namely, is the outlook for corporate earnings growth accelerating, thereby justifying higher PE multiples, or decelerating, suggesting just the opposite?
We’d say the answer in unequivocal: Economic and earnings growth have been steadily decelerating over the last decade and given the demographic, debt and fiscal pressures hanging over the US economy are likely to continue to slow during the decade ahead.
At the end of the day, nominal GDP is a proxy for earnings growth because over any appreciable period of time (save for the special factors addressed in Part 2), the earnings of a broad-based index of companies like the S&P 500 or even the Dow cannot grow much faster than nominal GDP.
As is evident in the chart, the trend growth of nominal GDP has been steadily lower. Thus, since the pre-crisis peak in Q4 2007, nominal GDP has expanded at just 3.3% per annum. During the previous cycle over 2000-2007, the rate had been 5.0%, and during the last four years of the 1990s the rate of nominal GDP growth was 6.0%.
We focus on these intervals because since 1996 there really hasn’t been a material reduction in the trend rate of inflation. So the argument that corporate earnings deserve a higher PE because they are higher quality and embody less “inflation” doesn’t wash.
Instead, the reality is that at the February 19th peak of the S&P 500 at 3380, the PE multiple stood at 24.5X reported earnings of $138 per share for 2019.
That is to say, there is no known financial algorithm by which you can square 3.3% growth (and falling) with a 24.5X capitalization rate.

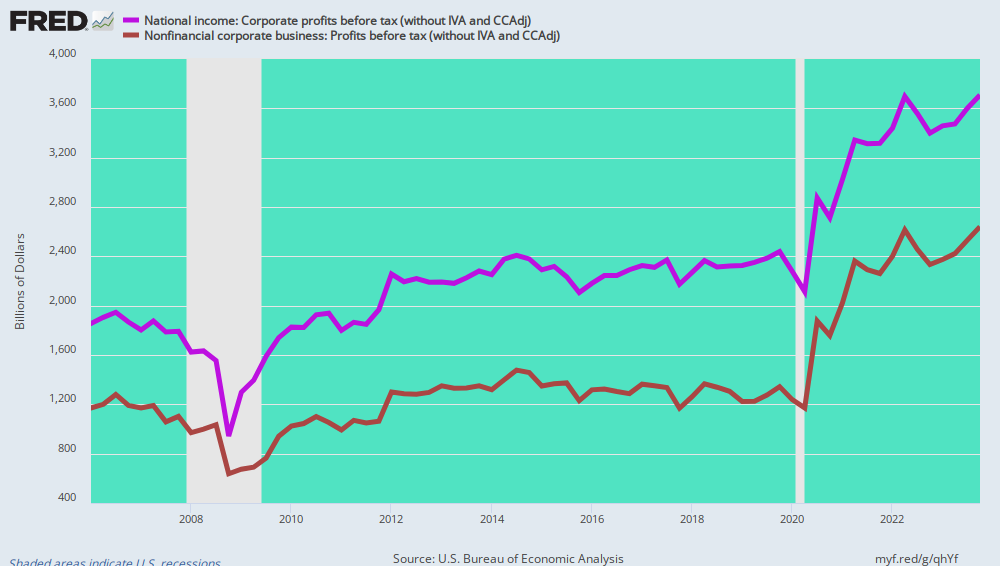
For want of doubt, the growth of aggregate profits in the US economy show the same turtle-like growth rate over the last decade. In the chart below we use pre-tax corporate profits to eliminate the distortion caused by the Federal tax regime beginning in Q1 2018.
For all corporations (purple line), annualized profits rose from $1.896 trillion in Q3 2006 to $2.045 trillion in Q3 2019. That amounts to a punk 0.61% growth rate over the last 13 years.
Worse still, pre-tax profits of nonfinancial corporations (brown line) actually dropped from $1.260 trillion in Q3 2006 to just $1.084 trillion in Q3 2019. Alas, the “growth” rates was -1.2% over the 13 year period.
By subtraction, the area between the purple line and the brown line represents mainly the pretax profits of banks and other financial corporations. In that category, pretax profits rose from $636 billion to $961 billion over the period, or by 3.2% per annum.
In short, the only “growth” in pretax corporate profits since way back in 2006 has been in the banking and financial sector, but that should be no surprise.
The good folks sitting in the Eccles Building with a hammer called interest rate repression have essentially done only one thing since the pre-crisis highs. They have pounded rates ever closer to the zero bound, permitting the financial sector to grow its profits essentially through the Fed’s subsidization of its cost of funds and deposits.
In Part 2, we will dive into the disconnect between the chart above for the entire US economy and the endless ballyhoo from Wall Street about the alleged sterling growth of profits by listed companies.
Much of those claims, of course, are phony and are based on cherry-picking start and end years, as well as to the endless game of ex-items adjustment of actual reported profits and hockey stick forward projections from sell side analysts .
But there is another factor that is totally ignored by Wall Street. Namely, the migration of profits to the big tech companies and Amazon from mostly unlisted or small cap main street retail and media companies.
That wasn’t permanent growth, however, it was a one-time reallocation.