Today was Jobs Friday and there was less joy in America last month than the headline 164,000 jobs print suggested. Actually, according to the ever perspicacious David Rosenberg the job count actually declined by 210,000 during July.
That’s right, and it’s because Rosenberg is counting how most of America actually works, which is by the hour and the gig, and not by how the BLS headline reports, which is a pure body count. Ten hours per week on a check-out counter and 50 hours per week in a steel mill are all the same to the ballyhooed nonfarm payroll (NFP) print.
Needless to say, Rosenberg is both a legend and unflinchingly honest, which is perhaps why he left Wall Street after decades at Merrill Lynch for a berth at a Canadian firm in Toronto. He was also laboring down in the weeds of the economic cycle long before most of the current Wall Street day traders were born or headline-reading algos were even invented, and has seen time and again what happens just before the cycle turns.
To wit, hours worked cool down first, then whole bodies are laid off, and, at length, the BLS revises away the birth/death jobs they spike the numbers with each month. That’s because when the business cycle is dying of old age, imbalances or external shocks and the economy slides into recession, the birth/death ratio goes negative and the 110,000 jobs per month which the BLS models add to the NFP count never happen.
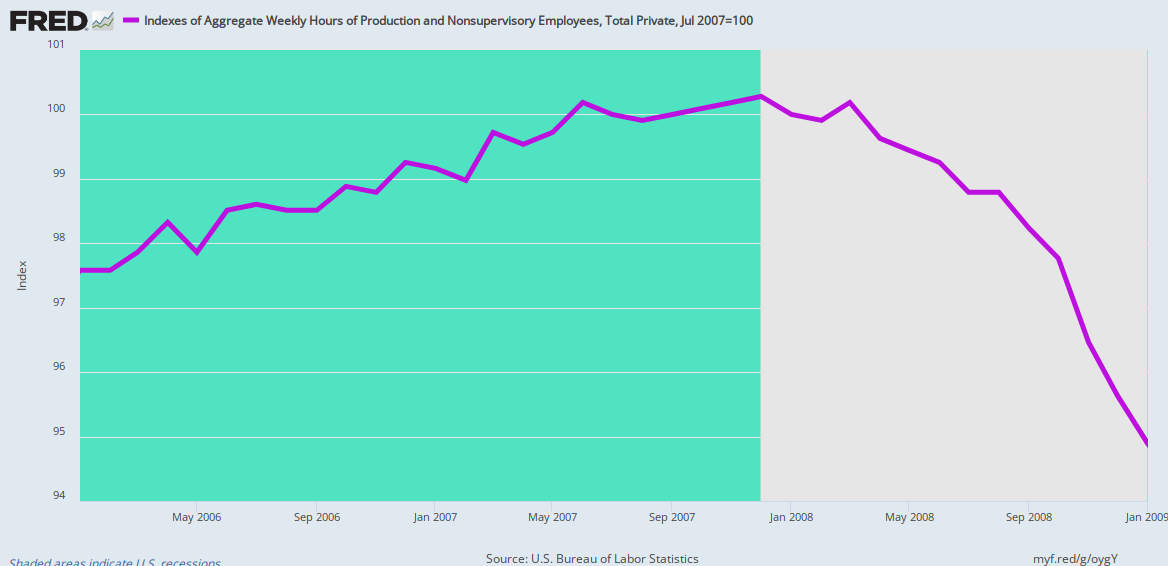
Accordingly, Rosenberg points out that the weekly aggregate hours index (purple line), which is the body count times average weekly hours worked, peaked in January 2019 and has been sliding downward ever since; and that’s a sharp change of direction from the 2.1% gain in aggregate hours during the prior 12 months.
Very clearly, therefore, the average NFP gain of 165,000 jobs per month since January is overstating the strength of the labor market; actual labor hours consumed by the US economy were actually 0.4% lower in July than at the beginning of the year.
The reason hours worked have been cooling far faster than total NFP headcounts in recent months is also shown in the chart. The culprit is average weekly hours (brown line), which has been heading sharply lower since January 2019, as well.

In turn, the reason for falling average hours (brown line) is reduced work schedules generally, but mainly a mix shift toward sectors with lower average hours per week (and also lower value added per employee).
As shown in the chart below, the Y/Y rate of gain in the goods producing sectors (red line) has fallen sharply from a 690,000 rate in July 2018 to just 338,000 in today’s report for this July. Yet the goods producing sector averages a high 41.0 hours per week.
By contrast, the Y/Y rate of gain for leisure and hospitality (blue line) has accelerated from 260,000 last July to 377,000 this July; and the gain for health care and social service employees has increased from 371,000 in July 2018 to 548,000 in the month just posted. However, average weekly hours in these sectors are much lower at 25.8 hours and 32.9 hours, respectively.
We discuss the rapidly decelerating growth rate of good producing jobs further below, but the implications are clear. As we near the end of the cycle, the NFP body count is increasingly overstating the strength of the jobs market. Underneath the hood, the hours driven labor economy has already hit stall speed.

As a matter of historical precedent, the above cooling of aggregate hours is very close to what happened in the run-up to the Great Recession. The index of aggregate weekly hours peaked in September 2007, after having risen by 1.8% during the previous 12 months—a rate very similar to the 2.1% gain in aggregate hours during the LTM period ending in January 2019.
The aggregate hours index then flat-lined through December 2007, when the recession officially commenced, and finally hit the ski slopes at accelerating rates as the recession gather forced in the second half of 2008.
However, the reported NFP job count kept rising at about 100,000 per month through early 2008—-long after the aggregate hours growth trend had stopped and rolled over.
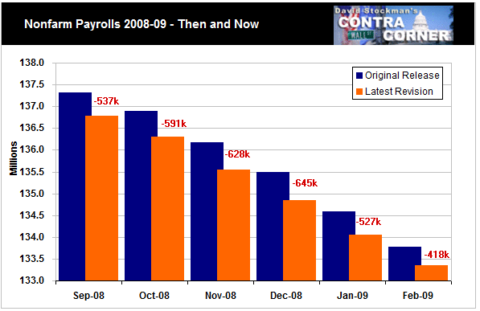
Indeed, even as the recession accelerated in the second half of 2008, the BLS headline numbers overstated what was actually happening. The blue bars below show the total NFP print for the heart of the crash—September 2008 through February 2009—as they were actually published by the BLS based on its model projections and guesstimates at the time.
By contrast, the orange bars are the final numbers for these same months after five years of revisions based on increasingly complete data from the payroll tax records of millions of employers. As a matter of practice, real employers do not send Uncle Sam tax money for phantom “birth/death” workers who are not on their actual payrolls.
Accordingly, the Jobs Friday initial print during this crucial six month period overstated the job count by an average of 564,000 per month.
This is all a large reminder that what matters at the end of the cycle is not the headline print, but the details under the hood and the mix of jobs and hours that are there reported.
For example, health care and education spending largely flow from the government fisc and are driven far more by demographics and legal entitlement authorities than economic conditions and discretionary household income. Nor are they very sensitive to Fed actions and the level of its policy rate: Students borrow regardless of interest rates, local education budgets are mileage driven and most health care is funded by Medicare/Medicaid transfer payments or tax-subsidized employer health plans.
By contrast, the output of the mining, energy, manufacturing and construction sectors, which generate the goods producing jobs, are highly sensitive to economic conditions and the business cycle—including increasingly the state of the global economy.
Stated differently, the goods producing jobs count (red line) is a leading indicator, while the health and education sector jobs count (purple line) is a lagging indicator, at best.
The chart below makes dramatically clear that the economic sugar high driven by the tax cut domestically and the China reflation in 2017-2018 is now over. From a Y/Y level of about 500,000 new jobs in late 2017, the goods producing growth rate picked up to nearly 700,000 jobs by mid-2018, but has now plunged back to earth at 377,000 in July 2019.
By contrast,the 500,000 Y/Y gain for health and education jobs at the end of 2017 has accelerated to 605,000 in July 2019.

Needless to say, the dramatic cooling of the good producing jobs sector tracks the incoming data on output and spending in these sectors.
Thus, private residential construction spending peaked on a monthly basis back in February 2019, and is now down by 10% on a seasonally adjusted annual basis. Likewise, non-residential construction spending has dropped by 2% since its cycle high in March and is now no higher than it was in February 2018.
Needless to say, the $1 trillion sector of the GDP represented by the construction spending chart below is not generating jobs and income growth at all, and looks to be sliding toward recessionary levels.

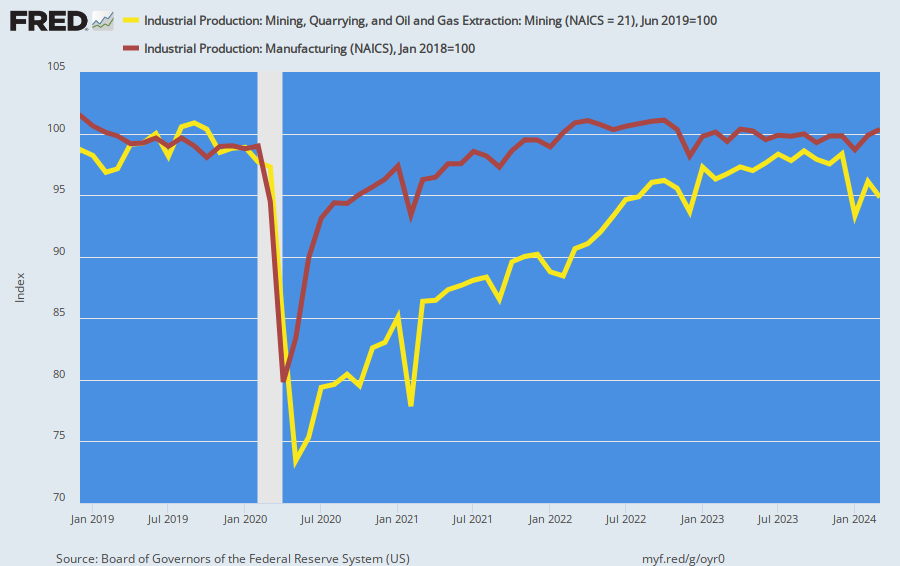
The same story pertains with respect to mining and manufacturing. The latter is now down by 2% from its 2018 sugar high and even mining—with a significant boost from the continuing recently cooling shale boom—- has also been leveling out.
Not surprisingly, aggregate hours worked in manufacturing are now down sharply from year-end 2018 levels and mining has crept higher only slowly.
As we will lay out in Part 2, this is just the beginning of the evidence with respect to the recession coming down the pike.
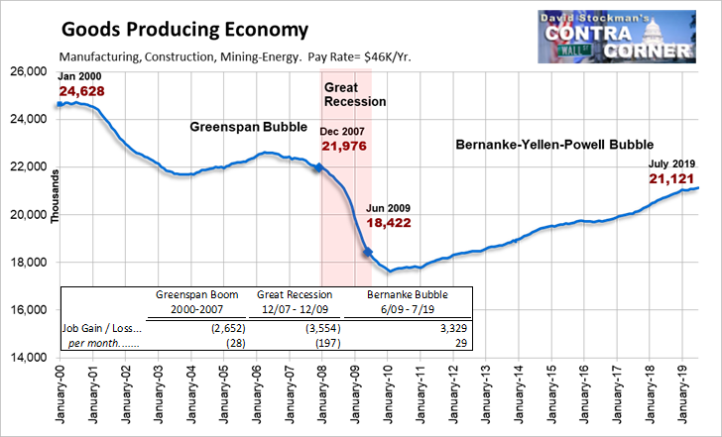
Yet after the longest business expansion in history and the greatest monetary stimulus ever imagined, the core goods producing sector of the US economy will end up with nearly one million fewer jobs than at the 2007 peak and more than 3.5 million fewer than at the December 2000 cycle top.