The chart-monkeys were buying the dips again today because that’s what they do. What they also do is resolutely ignore real world economic information that warns of recessionary troubles ahead, and there has been plenty of that in recent days.
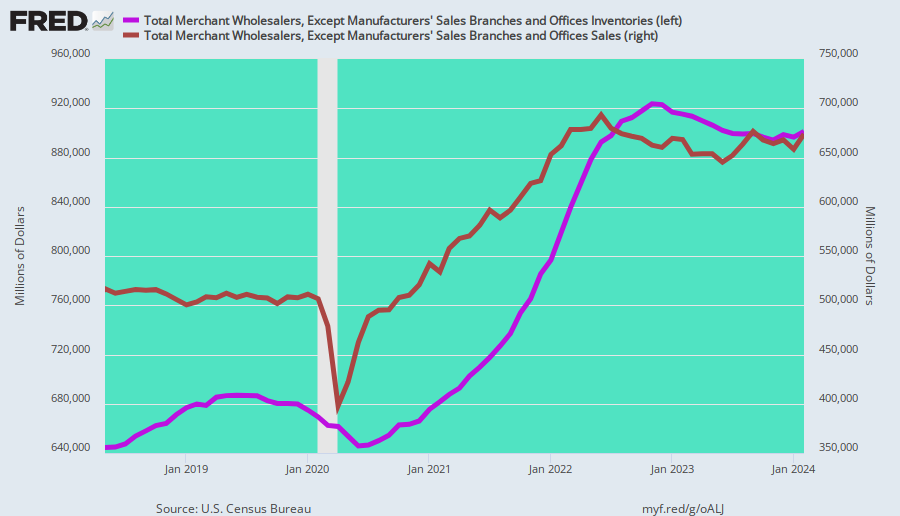
This morning, for example, the report on wholesale sales and inventories for June was a downright stinker. If you needed any more evidence that the Donald’s credit-card fueled sugar high of last summer is over, it’s right there in the chart below.
Wholesale sales (brown line) in June were actually down by 1.3% from the March peak and are now actually lower than the were back in May 2018 when last summer’s brief boomlet incepted. At the same time, wholesale inventories (purple line) have been soaring, and are now up by nearly $50 billion or 7.8% from May 2018.
Accordingly, the important inventory-to sales ratio has erupted from 1.256 in May 2018 to 1.364 in June 2019.
What comes next, of course, is inventory liquidation. The inventory/sales ratio for June, in fact, was the second highest since November 2008; and the chart makes very evident what happened next back then.