Capitalist prosperity and constitutional governance are under dire existential threat in America, and the three main causes are the Fed, the Fed and the Fed.
The leading edge of the this threat, of course, is impending fiscal catastrophe, anemic economic growth and a rapidly metastasizing maldistribution of wealth. All three stem from the destructive regime of Keynesian central banking which has arisen, congealed and become institutionalized during the past 30 years.
In the great scheme of things, the GOP’s historic job in American democracy was to fight this kind of deadly statist assault with hammer and tongs; it was supposed to be the guardian of fiscal rectitude, sound money and the free market engine of capitalist prosperity.
But the Republican Party is utterly, deeply and irretrievably AWOL on its fundamental mission. That’s because it’s been coopted by the cult of central banking which reigns supreme on both ends of the Acela Corridor.
To wit, the moneyed classes want Easy Money because it drastically and artificially inflates their financial assets; the Beltway political class embraces Easy Money because it deflates the carry cost of the nation’s mushrooming debts; and the massive vested interests which feed on the Warfare State/Welfare State behemoth—that is, the beneficiaries of Empire and Entitlements—could not survive, let alone thrive, without a red hot printing press at the ready in the Eccles Building.
So the GOP—and especially its so-called conservative wing—has parked its economic principles in what amounts to an ideological safe deposit box, pretending to be oblivious to the Fed’s assault on everything it purportedly holds dear.
Even when a corporal’s guard of Republicans on the Congressional Finance committees have occasionally scowled sideways at the Fed’s doings it has been completely in the wrong direction. That is, a critique not on behalf of free market price discovery in the financial system, but in advocacy of a latter day version of Milton Friedman’s “rules based” monetary central planning as now embodied in the idiotic formula of professor John Taylor.
Under his particular Rube Goldberg Contraption, the nation’s monetary politburo—otherwise known as the FOMC—would peg the federal funds rate at the sum of—
- the natural rate of interest; plus
- half of the difference between the actual and the target inflation rate; plus
- half the difference between the actual GDP growth rate and the “potential GDP” growth rate.
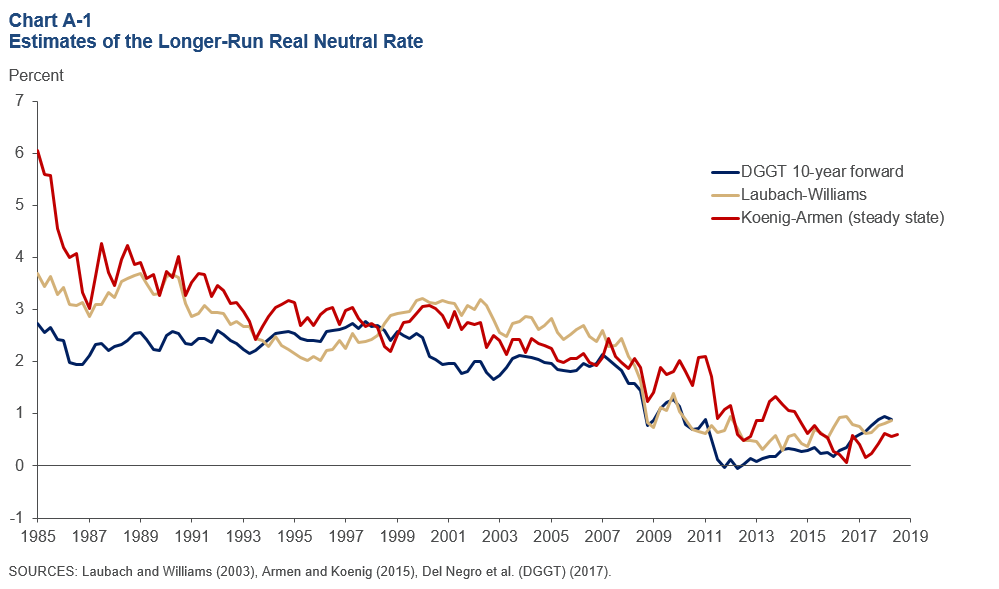
Of course, the “natural rate” of interest—or “r-star” in central banker jargon—is just a made-up theoretical number that the Keynesian eggheads have variously estimated between 6.00% and 1.25% over the last several decades, depending up whose ox was being gored, and when.
Here’s the estimates of three PhD teams at work, mainly characterized by the fact that they are all lifers at the various regional Federal Reserve banks. The latter are the only places that would actually pay a salary for what amounts to estimating the number of monetary angels that can sit on the head of a Fed funds pin.
But if you ever wanted an example of high flautin’ goal-seeked analysis, the chart below is it. As the Fed has become more and more dominated by the boot heel of Wall Street speculators and has found endless occasions and excuses to shove the trend level of interest rates net of inflation (see below) steadily lower, mirabile dictu (wonder to relate), these academic scribbles have discovered equations which say the constant (r-star) is constantly shrinking!
Likewise, the “inflation target rate” is another made up number, which is claimed to be 2.00% with no real empirical proof for it and much theoretical reasoning against—while the actual inflation rate can be measured six ways to Sunday based on the government’s wide range of highly arbitrary and manipulated general inflation indices.
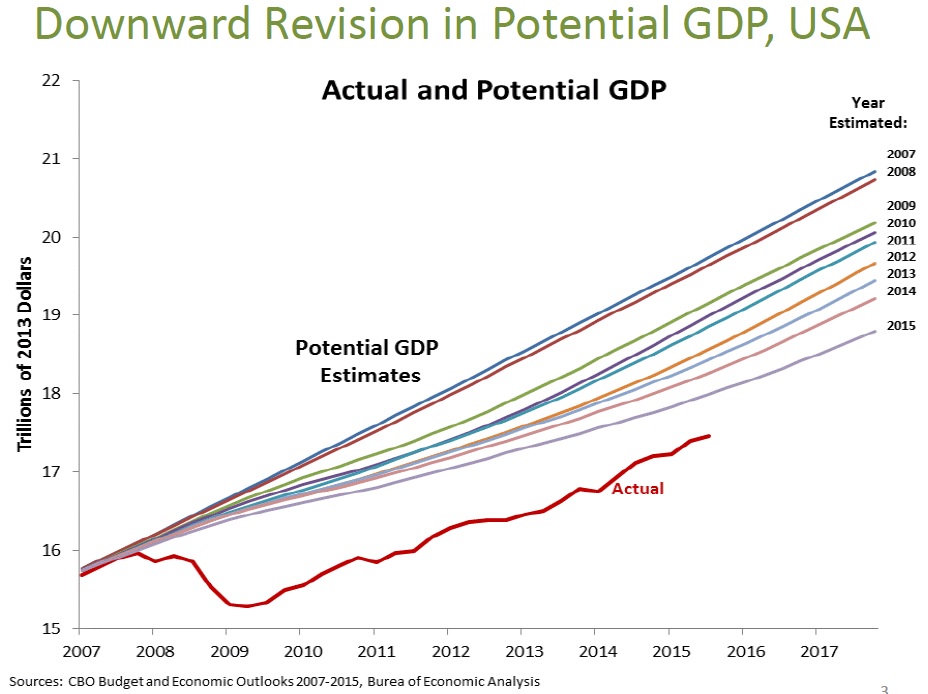
Finally, the academic phantom called Potential GDP is all in the eyes of different academic scribblers, who constantly change their minds over even short periods of time.
For instance, CBO publishes a long-term path of Potential GDP every year, but here are just the iterations from 2007 through 2015. For the year 2018, they range between $18.5 trillion and $21.0 trillion, and pretty much in descending order with each new iteration (i.e. they are always too high).
Folks, $2.5 trillion of difference is not close enough for government work; it’s just noise, nonsense and analytic gibberish.
Thus, the output capacity or Potential GDP of the US is a product of millions of constantly changing financial, technological, competitive, demographic and entrepreneurial factors. It can’t be conceptualized or measured. A thousand monkeys in a room of typewriters will come up with Shakespeare sooner.
Take a simple example such as the annual “capacity” of America’s 50 auto assembly plants to produce finished vehicles. The “correct” answer could vary by as much as 2:1—depending upon whether you assume two eight hour shifts operating five days per week with UAW holidays and other contractual downtime versus four eight hour shifts operating a staggered schedule seven days per week with Chinese or Korean style operating tempos.
And that’s only the beginning of the complexity. The level and sophistication of automation and robot operations would drive a wide range of maximum line speeds ( i.e. cars per hour are a function of capital and technology intensity). At the same time, an even greater range of supply chain reliability and proficiency factors and parts quality/rework rates would drive actual “up-times” and therefore realized line speeds.
The truth is, in today’s world there is no way to standardize the Potential Output of a car plant, a lumber mill or a Pilates studio. The dynamism, flexibility and innovative capabilities of free markets militate against it and continuously shape-shift the very notion of quantifiable capacity.
Similarly, among the US population aged 19-70 (212.5 million persons) there are 425 billion “potential” work hours per year based on a 2000 hour standard work year, but only 255 billion employed hours according to the BLS.
So what happened to the 170 billion difference or the potential hours of employment and output now going unutilized? And how do they factor into the above stipulated Potential GDP?
In point of fact, they don’t. The bean counters at the BLS assume that if they are work-at-home spouses (80 billion hours), full and part-time higher education students (30 billion hours) or part-time workers, social security disability recipients, pre-70 retirees, welfare bums or students living in mom’s basement (60 billion hours) they don’t count.
But who says? Would not different welfare policies, tax rules, student loan schemes or market wage rates (vs. unmonetized work at home) result in materially different estimates of “potential labor hours”? And wouldn’t those estimates evolve and morph as the underlying government policies and private mores changed?
The point is, no one has the foggiest idea what domestic Potential GDP actually is in a dynamic, fiercely competitive market-driven main street economy.
The PhDs at the Fed and their fan-boys on Wall Street and in academia just make up this rubbish to justify what they actually do: Namely, systematically, relentlessly and destructively falsify financial asset prices, thereby flooding the system with error signals and inducements for waste and misallocation of scarce economic resources.
Needless to say, the Taylor Rule is about as close to pure crack-pottery as it comes. By the professor’s own lights the Fed funds target should have been +7.5% at the top of the pre-crisis cycle in 2007 based on his 1999 estimates (red line) rather than +5.75% under his original 1993 estimates.