Foxified conservatives can get themselves lathered-up to rip-roaring rhetorical expectorations about Sleepy Joe’s failing mental acuity. But maybe its time they turned their guns on the apparently somnolent Elmer Fudd who currently passes for Fed Chair—a position from which more damage can be done than even the Oval Office.
Today’s red hot housing price reports brings this to mind. That’s because the Fed is still—utterly unaccountably—buying $40 billion of Freddie/Fannie paper every month and thereby driving mortgage rates even lower and housing prices even higher.
Yet when asked during an April press conference about how he justifies this bit of insanity, JayPoo delivered a stream of incoherence that even our 79-year old president has not yet matched.
Indeed, the man’s thoughts are so bereft of logic and connectivity that they might as well have come from a random word generator:
“Yeah. I mean, we started buying MBS because the mortgage-backed security market was really experiencing severe dysfunction, and we’ve sort of articulated, you know, what our exit path is from that. It’s not meant to provide direct assistance to the housing market. That was never the intent. It was really just to keep that as, it’s a very close relation to the Treasury market, and a very important market on its own. And so, that’s why we bought as we did during the global financial crisis. We bought MBS, too. Again, not intention to send help to the housing market, which was really not a problem this time at all. So, and, you know, it’s a situation where we will taper asset purchases when the time comes to do that, and those purchases will come to zero over time. And that time is not yet.”
In other words, they have their $120 billion per month bond-buying campaign ($80 billion UST and $40 billion GSE) on auto-pilot, and really don’t give a rip about the repercussions. But for crying out loud, even if they don’t intend to help the housing market, as crazy as the bolded phrases above sound, has it occurred to JayPoo & Co. that they might be doing a great deal of collateral harm?
After all, what’s the point of inflating residential housing values as an asset class when the effect is to capriciously bestow windfall gains and losses on America’s 130 million households, depending upon whether they own or rent and at what point in the Fed’s cycle of housing price inflation they bought or sold?
And we do mean housing inflation, both near and longer term. As to the former, Redfin’s monthly data showed that in April homes sold at their fastest pace on record with nearly 50% of listings off-the-market within one week; and also that the $344,000 median price was up 18% from a year ago and 27% from April 2019.
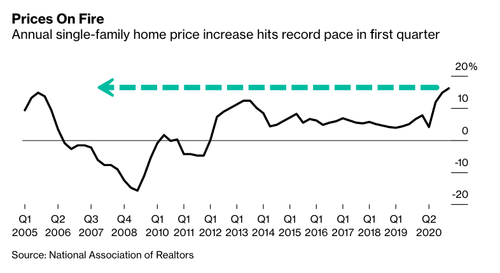
Nor is that a one month aberration. The data from NAR for existing home sales in all of Q1 show a price gain of 16.2%. That’s the highest YoY gain since the housing boom of 2005-2007 and we know how that ended.
“Nationally, the median existing-home sales price rose 16.2% on a year-over-year basis to $319,200, a record high since 1989. All regions recorded double-digit year-over-year price growth, with the Northeast seeing a 22.1% increase, followed by the West (18.0%), South (15.0%), and Midwest (14.4%),” NAR said.
Residential Housing Value Versus Aggregate Wage and Salary Income, 1987-2020

Needless to say, the reason is obvious as to why the Fed gives no thought at all to the anomaly of capriciously bestowed housing asset inflation, even as it claims to be not even seeking to help the housing sector. To wit, the BLS price indices indicate there ain’t much housing inflation to begin with, so why sweat it?
That’s right. Since the year 2000, the Case-Shiller housing price index (purple line), which is not in the CPI, has risen by 4.1% per annum. By contrast, the OER (owners equivalent rent) proxy for housing costs, which makes up 24% of the CPI, has increased by only 2.6% per annum.
Moreover, since the post-housing crash blowout stabilized in mid-2012, the spread has become even more dramatic: Case-Shiller is up by 6.5% per annum or more than double the 2.9% per annum gain in the OER.
In short, JayPoo says the Fed isn’t trying to goose housing while buying housing mortgage paper at a $480 billion annual rate; ignores a 6.5% rate of inflation, which has recently soared to double digits, because its not in the CPI; and ignores the CPI in favor of the PCE deflator because the somewhat frisky 2.9% per annum gain in the OER has a weight of only 13% in the latter compared to 24% in the CPI.
Some folks who don’t drink the Cool-Aid have accused the Fed of rigging the markets. Precisely. Rigging is exactly what they do—even in their choice of the data.
Case-Shiller Housing Price Index Versus the OER

Still, this morning’s sizzling producer price report suggests the rigging games played in the Eccles Building may be fast approaching their sell-by dates. Under present circumstances, when the CPI is already running at a 7.0% annualized rate of gain since January, what counts is the inflationary pressures coming up the supply chain.
In that regard, the PPI for intermediate processed goods does not bode well for the Feds’ “transitory” proposition. The index was up by 18.5% from a year ago, and represents the single largest YoY gain since, well, the historic inflationary blow-off in the spring of 1980!
Yes, last April the index was Covid-crushed, posting at -7.7% compared to April 2020. But the CAGR for the two-year stack still came in this morning at 4.6% per annum.
In fact, when you remove the “base effect” via the two-year stack analysis, the inflationary momentum building in the intermediate goods pipeline is even more dramatic than what we displayed yesterday for the CPI. During the last seven months, it has actually turned on a dime from moderate deflation to rapidly accelerating inflation:
PPI for Intermediate Processed Goods, Two-Year CAGR:
- October 2020: -2.37%;
- November 2020: -1.51%;
- December 2020: -0.12%;
- January 2021: +1.03%;
- February 2021: +2.21%;
- March 2021: +3.94%;
- April 2021: +4.60%

Here’s the thing. When the Fed is forced to reckon with the goods and services inflation clearly building in the supply chain it will throw a colossal spanner into the egregiously inflated financial asset markets—virulent inflation it has obstinately ignored and petulantly denied.
Yet there is not a day goes by in which one or another of the giant speculative bubbles that have resulted from its insane money-pumping does not scream out a warning. Today’s candidate in that regard might well be the fallout from Elon Musk finally saying something sensible.
After buying $1.5 billion of Bitcoin (BTC) to put on his balance sheet and suggesting that you could soon buy a Tesla with said currency, he has suddenly reserved course, saying that only greenbacks will be accepted in payment for his way over-priced and possibly dangerous green machines.
It turns out that Bitcoin miners are now consuming more electric power than the entire nation of Sweden and someone pointed out the glaring contradiction.

But the moral of the story is not that Elon proved his bonifides among the Climate Change Howlers. Rather, it’s the likelihood that the $70 billion loss of BTC market cap attendant upon Elon’s demarche will simply migrate to another coin, thereby keeping the $2.5 trillion crypto casino jumping and jiving.
After all, the whole joint had a market cap of just $1.0 trillion on January 1st, meaning that the crypto exchanges are chock-a-bloc with speculators who know that before the lights go out, the end-stage game is “rotation”.
The ever prescient student of markets, Mark St. Cry, got that exactly right in a missive this morning. BTC may be heading for the showers, but the coin rotation is yet to play out.
As I’ve said repeatedly – there is no profit gains in size and scale going on in Bitcoin than one can achieve in playing options, penny stocks, pink slips, etc. via regular plain old stocks.
Do you know why Ethereum is going up and Bitcoin is going down? All my conjecture, of course, but stop to think about it for just one nanosecond. It’s just money flowing from one (aka, the profits gained from one hustle) into another (aka, into the next hustle).
That’s why a joke such a Dogecoin suddenly went from a joke to a value worth $9 billion. You’re watching in real time the madness of crowds when there’s a vehicle to express it and tabulate it.
As this phenom was occurring, the one and only,
P.T. BarnumElon Musk decided through his infinite wisdom concerning all things crypto, that Tesla would no longer accept Bitcoin as payment rescinding his mere month or so old acceptance of it.The reason? “Insane energy consumption.” I.e., What it takes in energy to mine it.
If you believe the above is the true reason, then all I’ll say is: I have some spectacular ocean front property in Kentucky I’ll let you have, cheap. But, hurry and call before it’s gone!
Well, if not Kentucky ocean-front, perhaps Ethereum is the next best thing. Exactly one year ago, it had a market cap of $24 billion and as recently as January 1st is was just $84 billion.
Alas, the #2 crypto’s market cap now stands at $445 billion, meaning that its up 430% in the last four months and 1,650% in the past year.
So where did that $420 billion of new market cap—which is equal to the entire market cap of Johnson & Johnson— come from during the last 12 months?
Why exactly the same place that had Tesla trading at 1200X its regulatory-credit based net income a few weeks back, the S&P 500 valued at 36X net income today and housing prices flying out of the reach of a growing majority of American households.
That is to say, from a reckless crew of money-printers in the Eccles Building who have painted themselves so deep into a corner that they can no longer even coherently explain what they are doing, even as the make it up by the day.
Ethereum Price Index, May 2020-May 2021

If the Fed can’t see the insane $2.5 trillion crypto bubble starring it in the face, which has literally been speculated into existence in a record 2-3 year period, perhaps it might notice that its own backyard (Wall Street) is crawling with the kind bubble-upon-bubble madness that has always been a tell that the end is near.
Back in the 1920s they had holding companies pyramided one atop the next; at the top of the dotcom bubble companies were burning cash to buy eyeballs; and in 2008 gardeners and maids were buying McMansions with 5% down-payments gifted by the sellers.
But this time the speculative fevers have become manifest in the greatest gambling gimmick yet. Namely, ETFs which load up on high-flying stocks, which, in turn, attract more speculative capital requiring more ETF purchases of the underlying stocks, thereby goosing the spiral over and over again.
The reining queen of this double shuffle is one Cathie Wood, founder, CEO, and CIO of Ark Invest, the investment management firm she started in 2015.
Ark’s flagship fund is ARKK, which has grown from a few billion to $53 billion during the last several years. More importantly, it is a so-called actively managed ETF, which means it’s essentially an open-ended betting pool that chases whatever is flying higher at the moment, as long as it can be described by Wood as an exponentially growing disrupter with a compelling story, albeit one usually not encumbered with any measurable financial metrics in the here and now.
During a recent interview, Wood offered the following gobbledygook to explain her investment model:
“If we are right about how exponential growth technologies will scale exponentially, then our capacity should scale exponentially. Companies will need funding to win, and those with the biggest pools of data and the highest quality data will be in the pole positions to win in their respective spaces, which is why Tesla will win in the autonomous taxi space.”
Right, but we are not surprised that after an 700% gain between 2015 and the fund’s February 2021 peak shown below, and a 37% plunge since then, that Wood is confident that her sectors, technologies, companies and investments will grew to the sky just like magic. It seems she developed her view on macroeconomics while studying under Art Laffer and apparently got her seed capital from Bill Hwang of Archegos fame.
Needless to say, prior results are not an indicator of future performance, as they always say in the boilplate, but at the tippy-top of the greatest mania in history that admonition has an especial salience.
That’s because it’s only when the hustle starts going vertical that the hordes of homegamers and naive money piles on. What that means is that the claimed returns of the fund do not even remotely match the results actually obtained by the late arriving momo chasers.
In the case of ARRK, Wood claims a 43% compound return since the fund’s 2015 inception, but the good folks at Bespoke Investment Group recently calculated what they appropriately call the money-weighted annualized return since inception.
Alas, as of last Monday that was, well, 5.24% or far less than a steady investment in a plain vanilla S&P 500 index fund. The math worked out that way because the overwhelming share of holders bought in during the fund’s 250% run between April 2020 and February 2021.
Of course, with less than a 6% per annum gain left after the post-February plunge, it’s obvious that the homegamers who piled into the ETF during the last few months before the February 12th peak stand to loose their shirts big time.
And they will because the ARKK ETF is a really a FED (financial explosive device) sitting atop a handful of the most insanely over-valued stocks in the entire Wall Street casino.
For want of doubt, here is the top ten holdings of ARKK, which make-up fully 50% of the ETF’s entire portfolio. The valuation multiples against sales and net income are simply lunatic
Sales and PE Multiple by company and weight in ARKK portfolio:
- Tesla (10.3%): 17.5X sales, 570X net income;
- Teladoc (6.2%): 10.7X sales, negative net income;
- Roku (5.6%): 20.0X sales, 401X net income;
- Square (4.5%): 7.6X sales, 278X net income;
- Shopify (4.0%): 35.0X sales, 78X net income;
- Zoom Video (3.7%): 32.5X sales, 128X net income;
- Spotify (3.6%): 4.3X sales, negative net income;
- Zillow (3.5%): 7.5X sales, 670X net income;
- Twilio (3.3%) 21.7X sales, negative net income;
- Coinbase Global (3.2%): 41.5X sales, 168X net income.
So, yes, in the great scheme of things it’s hard to know who is more clueless about what is coming down the pike—Sleepy Joe or JayPoo.
But based on the latter’s utter incapacity per the excerpt above to explain why the Fed owns the staggering sum of $2.2 trillion of GSEs in the midst of a rip-roaring housing inflation, the tie might well go to the man in the Oval Office, who, by dint of ripe old age, at least has an excuse.
