The Turbulent Twenties and the coming baleful trends outlined in Part 1 have been gestating for decades in the chart below. Their driver and most visible manifestation is the nation’s crushing public and private debt levels, which now total $74 trillion, and the implied national leverage ratio, which has now nearly tripled since the halcyon days of the mid-1950s.
So we start with long view of debt and GDP because one toxic consequence of Keynesian central banking has essentially been the abolition of financial history. The market narrative is so oppressively focused on the most recent days, weeks and quarters that today’s perverted financial structure is unthinkingly presumed to be normal, stable and sustainable.
It is not.
What was “normal” is evident in the figures for mid-1954—a time when the distortions of World War II and the Korean War were pretty much behind and the US economy had embarked upon an extended period of solid growth, low inflation and financial stability.
At the time, total public and private credit market debt stood at $544 billion and GDP posted at $391 billion, yielding a national leverage ratio (Debt/GDP) of 1.39X. Incidentally, this national leverage ratio had oscillated narrowly around 1.5X for nearly a century extending back to the break-out of strong industrial growth after 1870.
Not surprisingly, the true inflection point came in mid-1971 on the eve of Tricky Dick Nixon’s folly at Camp David. During the intervening 17 years between 1954 and 1971:
- Real GDP growth had averaged 3.8% per annum and inflation had remained low most of the period;
- Nominal GDP had grown by 6.6% per annum and total public and private debt by 6.9%.
As a result of nominal GDP growth and debt growth tracking nearly on the same path, the national leverage ratio changed hardly at all—even though real growth and inflation posted the best 17 year trend of the 20th century. That is, the golden era of post-war prosperity occurred with virtually no change in the national leverage ratio at all—the boom was organic and a product of capitalism at work.
Thus, by the eve of Camp David, total credit market debt stood at $1.70 trillion and nominal GDP posted at $1.16 trillion, representing a national leverage rati0 1.47X.
Going back during the previous century of robust U.S. growth and rising middle class prosperity, a leverage ratio of 1.47X was par for the course, meaning that the US economy was still on course when Nixon pulled the plug on Breton Woods and the gold-anchored dollar.
At that point, however, the black area of the chart (total debt) begins to break away from the purple area (nominal GDP), meaning that the nati0nal leverage ratio began its long ascent from its historic 1.5X trend line. What followed between 1971 and 1987 was the raging double digit inflation of the 1970s, which had been triggered by a newly unshackled, money-printing Fed. and then the deep recession of 1981-1982, triggered by Paul Volcker’s about face toward severe monetary restraint designed to smoother it.
As is evident from the chart, there were three recessions during that 16 year interval, which obviously did not do much for macroeconomic performance. Consequently, CPI inflation surged to 6.7% per annum over the period while real GDP growth retreated to 3.2% per annum.
By contrast, the debt and leverage ratio lept sharply higher over 1971-1987:
- Total credit market debt grew from $1.7 trillion to $10.7 trillion or by 12.2% per annum;
- Nominal GDP rose from $1.16 trillion to $4.8 trillion or by 9.3% per annum; and
- The national leverage ratio spiked from its historic channel at 1.47X in 1971 to 2.22X by June 1987
So the smartly rising level of debt and the national leverage ratio during that transition period did not deliver any economic goodness at all. A pattern of more leverage and less growth was already evident.

During the first thirteen years of the Alan Greenspan regime at the Fed, the national leverage ratio lept higher still. Between Q2 1987 and the inception of the tech stock meltdown in Q4 2000:
- Total debt grew from $10.6 trillion to $28.6 trillion, or by 7.6% per annum;
- Nominal GDP rose from $4.8 trillion to $10.4 trillion or by 5.9% per annum; and
- The national leverage ratio climbed to an unprecedented high of 2.74X
During the early period of the Greenspan money-pumping era, however, the resulting stimulus to Wall Street supported a capital spending boom and flowering of technology innovation and adoption on main street. Accordingly, CPI inflation remained reasonably subdued, rising at a 3.2% annual rate during this interval, while real GDP posted at 3.3% per annum—the same rate as during 1971-1987.
During the first seven years of the 2000s, however, the Greenspan Fed cranked its money printing policy into high gear, allegedly to reflate the economy after the mild recession of 2001, but, in fact, to bail out the punters on Wall Street, which had been hit by a 85% meltdown of the NASDAQ 100 tech stock mania. This time the leverage ratio soared yet again—even as main street economic performance deteriorated sharply.
- Between Q4 2000 and Q4 2007, total public and private debt outstanding soared from $28.6 trillion to a staggering $52.6 trillion. That amounted to a private and public debt gain of $3.4 trillion per year, representing a 7.9% per annum growth rate;
- Nominal GDP rose from $10.4 trillion to $14.7 trillion or at a far more modest growth rate of 5.6% annum; and
- The national leverage ratio literally erupted right off the charts, rising to 3.58X.
At the same time, real GDP growth weakened to 2.5% per annum and inflation remained at 2.4% per annum.
At that point the wheels came off the wagon:After $24 trillion of total debt growth and a soaring and wholly unprecedented leverage ratio at 3.58X national income, it was more than enough to send Wall Street crashing and the main street economy into the drink of the Great Recession.
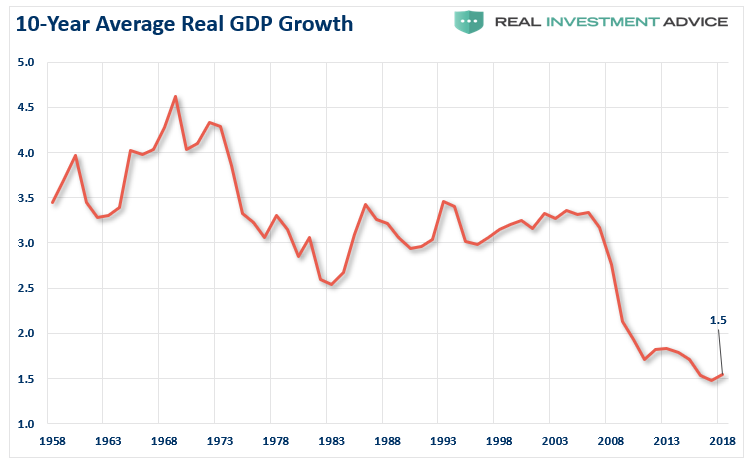
After Q4 2007 everything changed. The US economy apparently reached a point of Peak Debt. Accordingly, while both total debt and nominal GDP continued to rise by huge amounts, the leverage ratio remained flat, albeit stranded up in the nosebleed section of history. During the 12 years between the pre-crisis peak in Q4 2007 and Q3 2019:
- Real GDP growth slowed sharply to just 1.66%—the weakest trend growth rate since the Civil War, including the 1930s;
- total US debt grew from $52.6 trillion to $73.4 trillion or by 3.0% per annum, notwithstanding the so-called wake-up call of the financial crisis;
- nominal GDP grew from $14.7 trillion to $21.3 trillion or by 3.3% per annum; and
- the national leverage ratio weakened very slightly to a still record high of 3.44X.
In short, the chickens were already beginning to gather for the trip home to roost in the Turbulent Twenties ahead. And the pattern was now clear. The nation’s leverage ratio has been steadily ratcheting upwards for for nearly 50 years, even as the growth rate of real GDP was being driven steadily lower after the turn of the century.
Stated differently, at the 1.47X leverage ratio extant on the eve of Camp David in June 1971, total credit market debt today would stand at just $31.4 trillion, not $73.4 trillion.
So the two extra turns of debt on national income amount to $42 trillion-–a burden of incremental debt that is grinding the wheels of economic growth to a halt.
As we will show in Part 3, there is absolutely no doubt about how this baleful state of affairs came about. It is the work of the Keynesian monetary central planners domiciled in the Eccles Building and the other major trend-following central banks around the world.