Apparently, it’s not even a high plateau which comes rumbling down the inflationary path. The April PPI for finished goods reported this AM was 15.6% above its a year ago level, making it the ninth straight month that it was up by swiftly rising double digits.
Needless to say, the geniuses in the Eccles Building did not see it coming, although producer level inflation has been roaring up the pipeline in plain sight for well more than a year. In fact, the Y/Y index rose from 2.6% in February 2021 to 9.5% by last April, yet they sat on their hands for another 11 months.
In view of the historically evident lag between producer and consumer prices, the chart below is nothing less than a stinging indictment of the incompetence, malpractice and cowardice of the Federal Reserve Board, the head of which is about to be coronated for a second term by the Fed’s clueless overseers on Capitol Hill.
Y/Y Change In PPI Finished Goods Index, February 2021-April 2022

Moreover, it’s not as if the above numbers were so ordinary that they could have been innocently overlooked. Actually, the April increase is the highest PPI spike in the last 47 years, which, in turn, was the only time that April’s gain has been exceeded since 1948!
So the inflationary locomotive was barreling down the tracks, but the Fed heads kept their feet on the monetary accelerator to the tune of $120 billion per month of bond purchases until the engine noise became deafening—even in the inner sanctum of the Eccles Building.
Here’s the thing, however. What is depicted in these charts is powerful inflationary momentum that will take years to vanquish via tiny 25bps and 50bps rate increases. The only thing that can slow down the inflationary freight train, therefore, is gob-smacking three-digit rate increases capable of shutting down new borrowing completely, thereby materially draining demand from overheated domestic product and labor markets.
That’s not about to happen, of course. Instead, what lies ahead is a tangle of start-and-stop anti-inflation maneuvers by the Fed that will only prolong the inflationary disaster now upon us, even as the latter is inexorably destined to end in a hair-curling recession.
Y/Y Change in PPI for Finished Goods, 1948-2022

For want of doubt, here is a reminder of what the Volcker Fed did in the face of rapid increases in the PPI for finished goods, albeit increases which were actually lower than at present.
When Volcker became Fed Chairman in August 1979, the finished goods PPI was running 11.1% above prior year, but even the dovish Miller Fed had pushed the Fed funds rate up to 10.9% in a belated effort to tame the inflationary storm.
As shown by the yellow line below, however, Volcker meant business when it came to the basic idea that money should retain it purchasing power. Within eight months (April 1980) he had the funds rate up by 670 basis points to 17.6%, and then after backing-off temporarily, pushed it to a peak of 19.1% by January 1981.
Short-term interest rates of these magnitudes, of course, are from a different and more sober monetary universe. But what screams out from the chart below is that the inflation rates (red line) were not.
That is to say, the peak Y/Y rate for the finished goods PPI posted at 14.7% in August 1980, a level actually below the 15.6% rate reported this morning for April 2022. Yet Volcker attacked it with such alacrity that by the time interest rates had peaked in early 1981 the Y/Y rate on the PPI had already dropped by one-fourth to 11.3%.
By contrast, the Powell Fed has the funds rate at a barely visible 85 basis points, meaning there is no chance whatsoever that today’s double digit PPI will be rolling-over per the chart below anytime soon.
Federal Funds Rate Versus PPI Finished Goods In Volcker Era, 1979-1981

Back in those purportedly benighted times, of course, the Fed was not constrained by the hoary wealth effects doctrine. So Volcker reasoned, correctly, that the back of inflation could not be broken unless interest rates were pushed well into the positive real yield zone. Otherwise, household, business and government operators, too, would borrow at will, knowing that carry costs would be negative in real terms and that debts could be eventually redeemed in sharply depreciated dollars.
But there was also another factor at work during the Volcker era of double digit inflation. To wit, the US economy had not yet become saturated with unpayable debts.
Thus, in Q1 1981 when the funds rate was pushed to its 19.1% peak, the GDP stood at $3.12 trillion compared to total public and private debt of $4.94 trillion. Mathematically, that amounted to a 1.58X national leverage ratio—a level in line with the 1.50X debt-to-income ratio that had prevailed since 1870.
Today, however, the national leverage ratio is from a different universe. As of the end of 2021, total debt stood at $88.3 trillion, which was 18.0X the level in Volcker’s time, while the nominal GDP weighed in at $24.0 trillion, or just 7.7X the GDP of Q1 1981.
Accordingly, the national leverage ratio now stands at 3.68X, signifying the accumulation of two turns of extra debt during the past 42 years.That is to say, at the leverage ratio which prevailed when Tall Paul Volcker took a 19.1% funds rate club to the inflationary fires raging in 1979-1981, total public and private debt would stand at just $38 trillion.
In round terms, therefore, the US economy is freighted down with $50 trillion more of debt relative to income than prevailed in early 1981. No wonder the denizens of the Eccles Building are so cowardly: They are deathly fearful of the debt-ridden LBO’d economy they have fostered over the last four decades.
National Leverage Ratio: 1981-2021

Perhaps these realities are beginning to leach into even the BTFD precincts of the casino, where “Risk Off” has suddenly become a thing again.
What comes to mind in that regard is the cryptoverse, which has gone into meltdown mode during the last 48 hours, with Bitcoin itself touching $25,401.05 in the wee hours this AM.
That brought the price of Bitcoin down 22.4% in the last five days alone, and by 47% since the beginning of the year and 62% from its all-time high (ATH) of $67,500 six months ago on November 8, 2021. Altogether, this morning’s low completed the below depicted round trip since December 26, 2020.
Some “store of value”!
Bitcoin Price, December 2020 to May 2022

As we have said all along, cryptos are not new money aborning. They are just the latest “risk asset class” to be seized upon by the casino and homegamers under the delusion that 25%, 100% and 1000% accretions to wealth are possible in a virtual investment heartbeat with no more effort than hitting the “buy” key on shiny objects that are momentarily rising.
To be sure, we are all for private money gestated outside the clutches of the state and its central banking arms. But we also fear that central banking has gone so far off the deep-end that it has corrupted and polluted nearly every good invention and innovation that has come down the pike of what remains of private capitalism.
For example, Goggle was one hell of an innovation in the advertising space when it comes to efficient targeting of dollars spent. But it was never worth its peak market cap of $2.0 trillion touched last November 19th, or even the 25% lower $1.49 trillion at which it closed today. Those inflated valuations were the work of an unhinged casino intoxicated on central bank liquidity.
Likewise, Apple is undoubtedly the greatest tech products machine ever invented, but it was never worth the $3.0 trillion market cap it touched on January 3rd or even the $650 billion lower valuation at which it closed today.
That’s because the implied PE multiples at those valuations of 29X and 23X, respectively, are not sustainable owing to the iron laws of GDP growth and large numbers.
As it is, Apples LTM net income growth rate had slowed to 10.5% during the seven years since 2015, and rose sequentially at only a 5% annualized rate in the March 2022 quarter just ended.
Needless to say, a market which cannot rationally discount the future earnings streams of two profit monsters that posted combined LTM net income of $175 billion in the March quarter, doesn’t have a snowballs chance in the hot place of properly valuing crypto coins, which have no earnings and no apparent uses as money.
After all, there are now 19,410 different crypto coins traded on 526 exchanges with a combined market cap of $1.12 trillion. But given the history of the past two years, you could have done better throwing darts at the wall than trying to fish the future winners out of the frenzied crypto-swamp fueled by the Fed’s insane money pumping.
Thus, two years ago on May 10, 2020, the combined market cap of the cryptoverse weighed in at $240 billion. That figure then exploded by 12.1X until it reached $2.91 trillion on November 9, 2021.
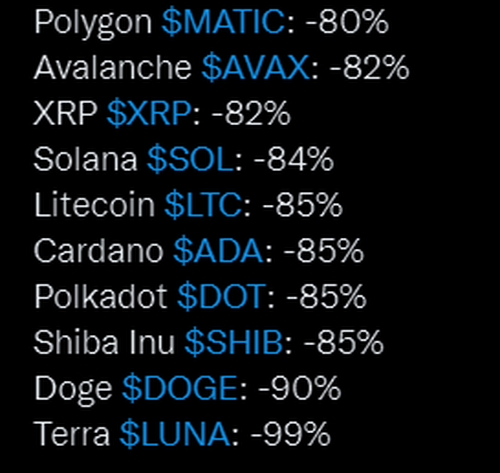
Alas, the crypto-tree didn’t grow to the sky, either. At today’s market close the combined market cap of the 19,410 wanna be moneys was down 60%.
Of course, we have heard no one on bubble vision today admitting to loosing three-fifths of their investment in six months. But the fact is that $1.7 trillion of alleged crypto value has vanished from some several million block chain accounts since last November. Among them might be the holders of these much ballyhooed coins.
% Change From All-Time High
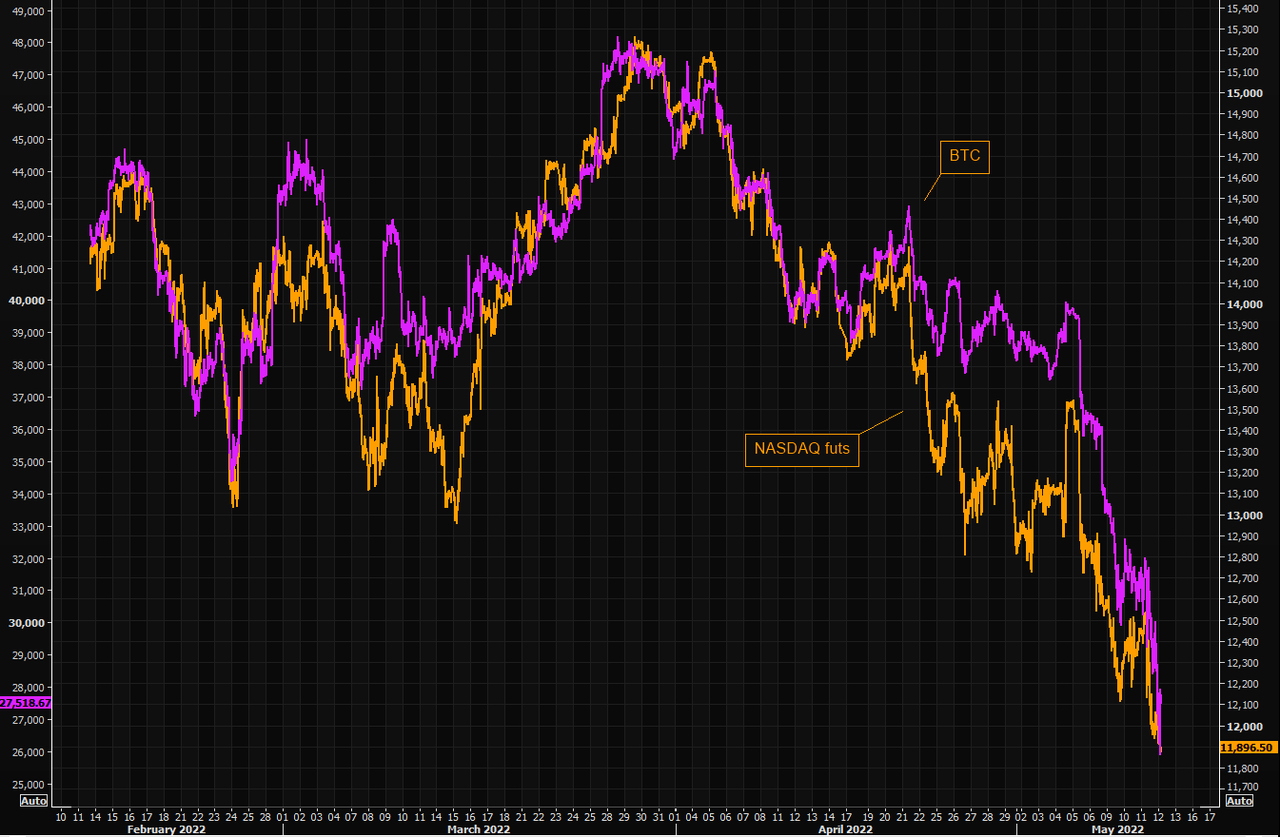
The truth is, the cryptos have been just a gambling sidecar to the most speculative precincts of the stock market all along. After the surge of 2020-2021 especially, they began to move in exact lockstep with the NASDAQ as fast money hedge funds and family offices entered the space.
We don’t know whether the chart below embodies a correlation of precisely 1.0, but we’d say its close enough for government work.
And we’d also say that such correlation has absolutely nothing to do with the birthing of honest money. To the contrary, the cryptoverse has been fatally infected in the cradle by the bad money of the Fed and other central banks.
Correlation Between NASDAQ And Bitcoin Since February 1, 2022
That the cryptoverse has become polluted with speculative madness should have been evident all along, but with the spectacular collapse of the TerraUSD “stablecoin” in recent days all cause for doubt has been removed.
To be sure, the very existence of so-called “stablecoins”, which are just fake dollars created for the purpose of facilitating crypto-coin wagers on the blockchains, should have been a red flag. That is, if Bitcoin, Ethereum and their ilk are actually money, why did you need fake dollars to intermediate the trading of one money for another?
The answer, of course, is that the coins themselves are too volatile to trade bilaterally, so we ended up with a super-money in order to shuffle the wanna be money. Accordingly, most of the popular stablecoins such as Tether maintain their fixed rate to the US dollar with assets that include dollar-denominated debt and cash.
However, TerraUSD went the next mile. It was what is known as an algorithmic stablecoin, which relied on financial engineering to maintain its link to the dollar. That is to say, it amounted to a Jr. Fed on steroids.
TerraUSD therefore kept its $1 price by relying on traders who acted as its backstop. When it fell below the peg, traders would burn the stablecoin—removing it from circulation—by exchanging TerraUSD for $1 worth of new units of a crypto coin called Luna. That action reduced the supply of TerraUSD and raised its price.
Conversely, when the value of TerraUSD rose above $1, traders could burn Luna and create new TerraUSD, thus increasing the supply of the stablecoin and lowering its price back toward $1. This might otherwise be considered the equivalent of doing chin-ups from a sky-hook.
Alas, when a run on this algorithmic stablecoin developed a head of steam in recent days, it was all over but the shouting. The arbs apparently were induced to buy TerraUSDs at such a fantastic rate that they sold Luna into oblivion. Consequently Luna has traded down to 3 cents, representing a 99% plunge from its price just 24 hours ago.
That’s right. As recently as April 3rd, Luna had a market cap of $41 billion. So in the very best imitation of the South Park episode when Stan went to the S&L to invest the $100 he got from his grandma, we can now say with the bank manager, “and its….gone!”
https://www.youtube.com/watch?v=Y3AM00DH0Zo
Nor is the carnage in the cryptoverse all that has been triggered by the sudden realization that the money-printing jig is up. As Bloomberg recently documented, the new homegamers who entered the meme stock space 15 months ago may have “never seen a market that wasn’t supported by the Fed.”
Now they have. These clueless gamblers lost all the gains they made in the Dogecoin, AMC and GameStop rallies, and are now exactly back at square one.
Yet with inflation pushing into double digits and the Fed taken hostage on its own petard, regressing to square one is not even remotely the end of it; it’s barely a start.