The laziness of the financial press appears to know no bounds. For instance, this gem from the Wall Street Journal purports to explain today’s red hot inflation number:
There are several reasons behind this bout of high inflation. First, the economy is strong and employers have been adding more than 400,000 jobs for 11 straight months.
Really?
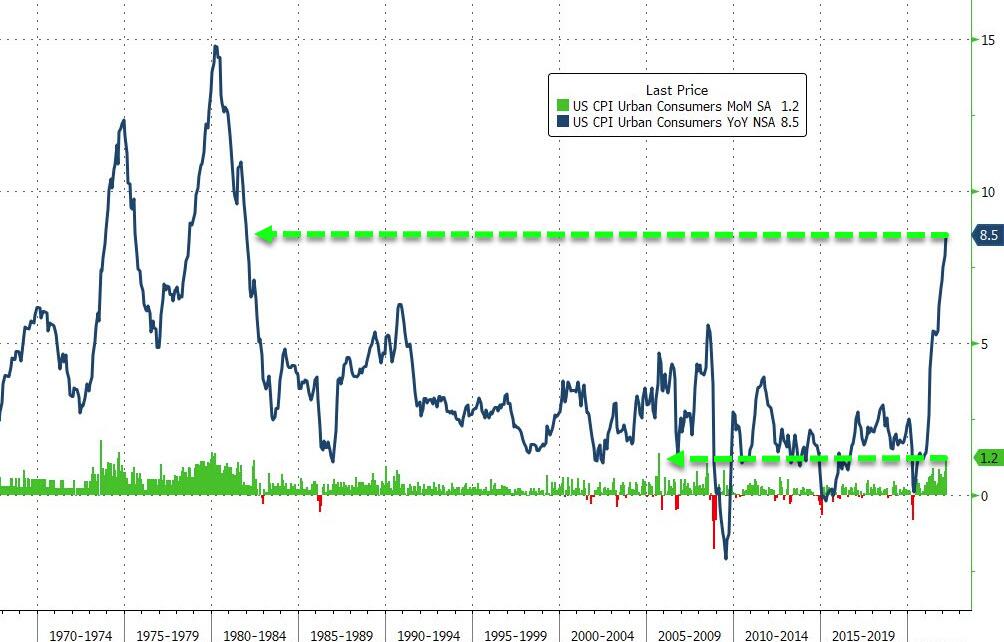
In July 2019 the nonfarm jobs count (purple line) of 150.921 million was virtually identical to the March 2022 figure of 150.925 million. To be exact, we are talking about a 4,000 jobs difference in an economy with a potential work force of more than 200 million.
Nevertheless, despite a 4.2 million increase in the population since then, which has made the labor market slightly looser, the Y/Y inflation rate in March 2022 of 8.55% was 4.7 times higher than the rate of 1.82% back then.
Self-evidently, the US economy isn’t strong, while the domestic job situation—which has just barely returned to the July 2019 status quo ante—has had precious little impact on the accelerating inflation rates to date. Instead, the gale force of inflation is largely imported, owing to soaring, globally-priced energy, food and other commodity prices and the double whammy of supply chain disruptions, first from the Covid-Lockdowns and now from the Ukraine War.
Of course, the fact that the leading edge of goods and services inflation has originated in the global economy makes our point about the impossibility of central banking in one country all the more salient. In order to even begin to dent the reported CPI figures in the next few quarters the Fed will have to monkey-hammer the stock and bond markets like never before—given that these red hot gambling venues have become its main transmission channel to the main street economy.
Total Nonfarm Employment Versus Y/Y Change In The CPI, July 2019-March 2022

As it happened, the March CPI came in at 8.5% on a Y/Y basis—-the highest rate of gain since December 1981. But it was the composition of that figure which makes a mockery of Wall Street’s knee-jerk reaction to a BLS report that purportedly “was not as bad as expected”.
That is to say, the overall index was goosed heavily by food, energy, commodities and durables. All of these components are now soaring toward double-digit territory, yet these are the very items—as opposed to domestically produced services—-that the Fed has the least influence over.
Consequently, the Fed’s impending interval of inflation-fighting will be arduous, prolonged and unrelieved. That’s because reduction in measured inflation rates will depend upon a sustained easing in global commodity markets and supply chains—stubborn sources of inflation during the next few years over which the Fed has precious little leverage.
For instance, consider the explosion of food prices. After dwelling in the 1-3% per year zone for most of the decade after 2012, they are now soaring and were up by 8.8% Y/Y in March.
Moreover, the vertically ascending black line in the chart below is just getting started. It is now clear that the war on the rim of the Black Sea will knock out up to half of Ukraine’s massive farm production during the current crop season. Likewise, the risks to shipping from the Black Sea ports for both Ukrainian and Russian foodstuffs and fertilizer, along with the sanctions, will have an immensely negative impact on global farm output during the current crop year.
As it happens, the nearest thing to the black earth of Ukraine’s river valleys is the same black earth in the Illinois/Iowa/Upper Midwest river valleys of the Mississippi. But the latter is so calibrated to the massive fertilizer applications needed to generate 200 bushels of corn per acre and the like, that soaring fertilizer prices—up by 4X for some types—will cause farmer application calculations to change drastically. That is, they will apply far less per acre, causing US yields to fall notwithstanding that the cornfields of Illinois are far, far from the Ukrainian fields of battle.
CPI Food Price Index, 2012-2022

Consequently, food prices are nearly guaranteed to erupt well into the double digits by the end of this year and into 2023. In fact, the CPI food price index is likely to peak somewhere near the level last reached in December 1973 (20% Y/Y).
Of course, that’s a whole new ball of wax for the Fed and other central banks. If food price-driven inflation is not forcefully and credibly addressed, their vaunted “independence” owing to a virtually certain populist uprising is most definitely at serious political risk.
Y/Y Change In CPI Food Index, 1973-2022

The story is similar for durable goods. After 34 straight quarters of essentially negative price change due to the proliferating global supply chain and the drive toward ever cheaper labor and production costs, durable goods pricing has now violently pivoted higher. During Q1 2022, in fact, the CPI durables index was 17.4% above prior year.
Again, there is nothing on the horizon to suggest a radical abatement any time soon. Indeed, whatever the motivation of China’s Red Suzerains for the sweeping lockdown in Shanghai and elsewhere at the moment—a genuine fanatical pursuit of Zero-Covid or just an excuse to send a message to Washington’s war-mongers—-the fact is, global supply chains are being hit good and hard, yet again .
It will likely be years, in fact, before the Y/Y change in durable goods gets back toward the Fed’s 2.00% target, to say nothing of the negative run that kept overall inflation low for the better part of the past decade.
Y/Y Change In CPI For Durable Goods, 2012-2022

To be sure, the service components of the CPI are not exactly tame, either. After rising in the 2-3% zone per annum during most of the last decade, the overall services index has sharply accelerated during the past year, and in March was up by 5.1% over prior year.
Alas, that component is just getting up a head of steam, too. That’s because a major sub-component of services is housing rents, both as directly measured for 45 million renter households but also the essential ingredient of the OER index for 80 million homeowners.
As it happened, the Y/Y rental and OER indices were up by 4.4% and 4.5%, respectively, in March. That’s materially below the 5.1% average for all services, but, more importantly, is way behind the Zillow market-based rental index which was up by 17% during the most recent month.
The thing is, the BLS index is constructed in such a manner as to cause reported rental rates to lag the real world marketplace by up to six months. So, again this huge 32% component of the CPI will pushing the services index very far north of 5.1% in the months ahead.
Y/Y Change In CPI Services Index, 2012-2022

Finally, there is the matter of energy and commodities generally. The short of it is that the March CPI index for all commodities came in at the highest level ever recorded.
That’s right. Compared to prior inflationary blow-off tops, the March 2022 Y/Y figure now stands in a league all by itself:
Y/Y Change In CPI Commodities:
- Q1 2022: 14.22%;
- Q3 2008: 6.68%;
- Q1 1980: 13.69%;
- Q4 1974: 12.83%.
Here’s the thing. Between Russia, Ukraine and Belarus we are talking about the geographic mother-lode of energy, metal and agricultural commodities. For reasons we amplify below, the Ukraine War is not likely to end any time soon, meaning that between the Black Sea choke points, the destruction of economic activity in Ukraine and the unhinged Sanctions War against Russia there will be no return to normality and commodity sector supply/demand equilibrium for a long while to come.
The Fed, of course, will say that it is not responsible for the Washington/Brussels War on global commodities central. But never mind. Soaring commodity prices will insure that overall inflation remains “extraordinarily” elevated for many quarters to come.
Accordingly, whether they like it or not, the money-printers will be out of business for the foreseeable future.
Y/Y Change In CPI Commodities, 1957-2022

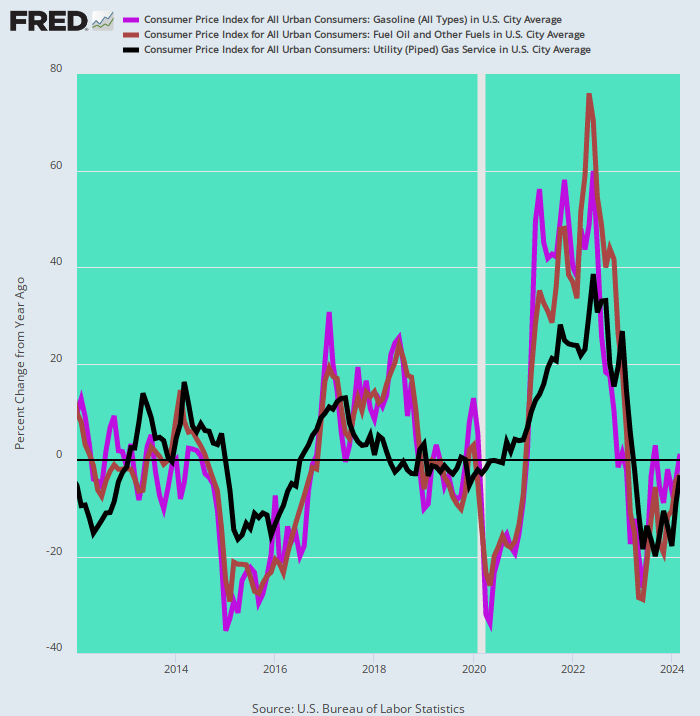
The heart of the commodities price eruption, of course, is energy. And in that case the price increases have been so huge and threaten to rise even higher that they will not work their way out of the overall inflation index for numerous quarters to come, even as their secondary effects filter through to industrial, transportation and services prices.
In that respect, the March gain over prior years for the three main energy commodities used by households was literally off-the-charts of history. Price change compared to March 2021 was as follows:
- Fuel Oil: +51.7%;
- Gasoline: +48.0%;
- Natural Gas: +21.7%
Y/Y Change In Fuel Oil, Gasoline and Natural Gas, 2012-2022
This gets us to the insanity of Washington’s meddling in the Russia/Ukraine dispute and its unhinged Sanctions War against the former.
What this is doing is prolonging a destructive war that Ukraine cannot win; recklessly pursuing Washington’s purported right to determine what happens on Russia’s doorstep; and destroying the dollarized global trading and payments system upon which America’s tenuous prosperity actually rests.
Yet Washington is now so invested in this wrong-headed adventure that it has essentially turned over the keys to the dangerous clowns who run the Kiev government. They have been falsely turned into the very embodiment of Churchill heroes, while the endlessly corrupt, authoritarian, neo-Nazi influenced ceasepool which passes for the Ukrainian government has purportedly become the front line in the battle for democracy and human rights.
Not surprisingly, therefore, the drastically empowered Ukrainian whiners are once more demanding an embargo on Russian oil and that energy traders stop trading with them entirely. According to Business Insider:
Wartime sanctions haven’t fully stopped the flow of energy exports out of Russia—and that’s unacceptable to President Volodymyr Zelenskyy. The government has asked some of the biggest commodity traders to stop moving Russian oil.
“The fact is that traders are trading and they are helping Russia to receive this blood money,” one of Zelenskyy’s advisers, Oleg Ustenko, told the Financial Times Sunday.
It so happens that Russia exports around 6 million barrels of oil per day. Within the context of a 100 million barrel global oil market that’s the difference between $100 per barrel oil and $300 per barrel.
So these clowns in Kiev essentially want the world to commit economic Harri Kari. And that’s all because they previously insisted on joining NATO and waging a brutal war on the Russian-speaking population of the Donbas for the past eight years—-a savage endeavor which resulted in 14,000 civilian deaths and which by comparison pales the current Russian-caused civilian harms.
Yet there is likely no turning back. As the Russians eventually take control of the Donbas and northern rim of the Black Sea, the Washington/Brussels chicken-shit sanctions war against Russia will be cranked up to absurd levels, including further disruption of the energy complex.
Did the Fed see all of this coming?
Of course not.
But in taking their balance sheet from $900 billion to $9 trillion in less than 14 years did they consider the possibility of a Black Swan in global commodity markets and supply chains?
Evidently, they did not.